QUESTION IMAGE
Question
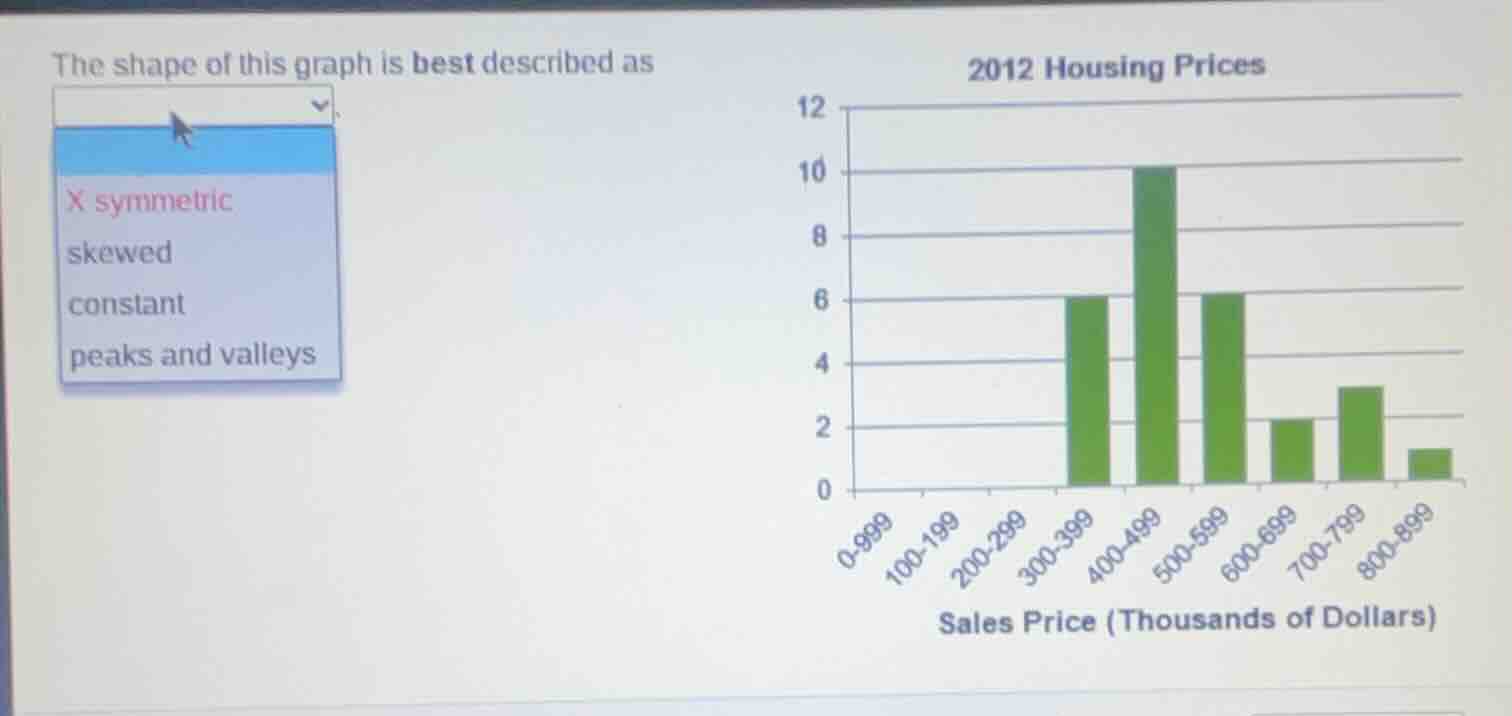
the shape of this graph is best described as
x symmetric
skewed
constant
peaks and valleys
2012 housing prices
12
10
8
6
4
2
0
0-999
100-199
200-299
300-399
400-499
500-599
600-699
700-799
800-899
sales price (thousands of dollars)
Brief Explanations
A symmetric distribution has mirror-image left and right sides around its peak. This histogram's peak is in the middle, with the left side (300-399) matching the right side (500-599), and the shorter bars on the far left (0-299, all 0 count) mirroring the shorter bars on the far right (600-899) in relative height pattern.

Snap & solve any problem in the app
Get step-by-step solutions on Sovi AI
Photo-based solutions with guided steps
Explore more problems and detailed explanations
symmetric