QUESTION IMAGE
Question
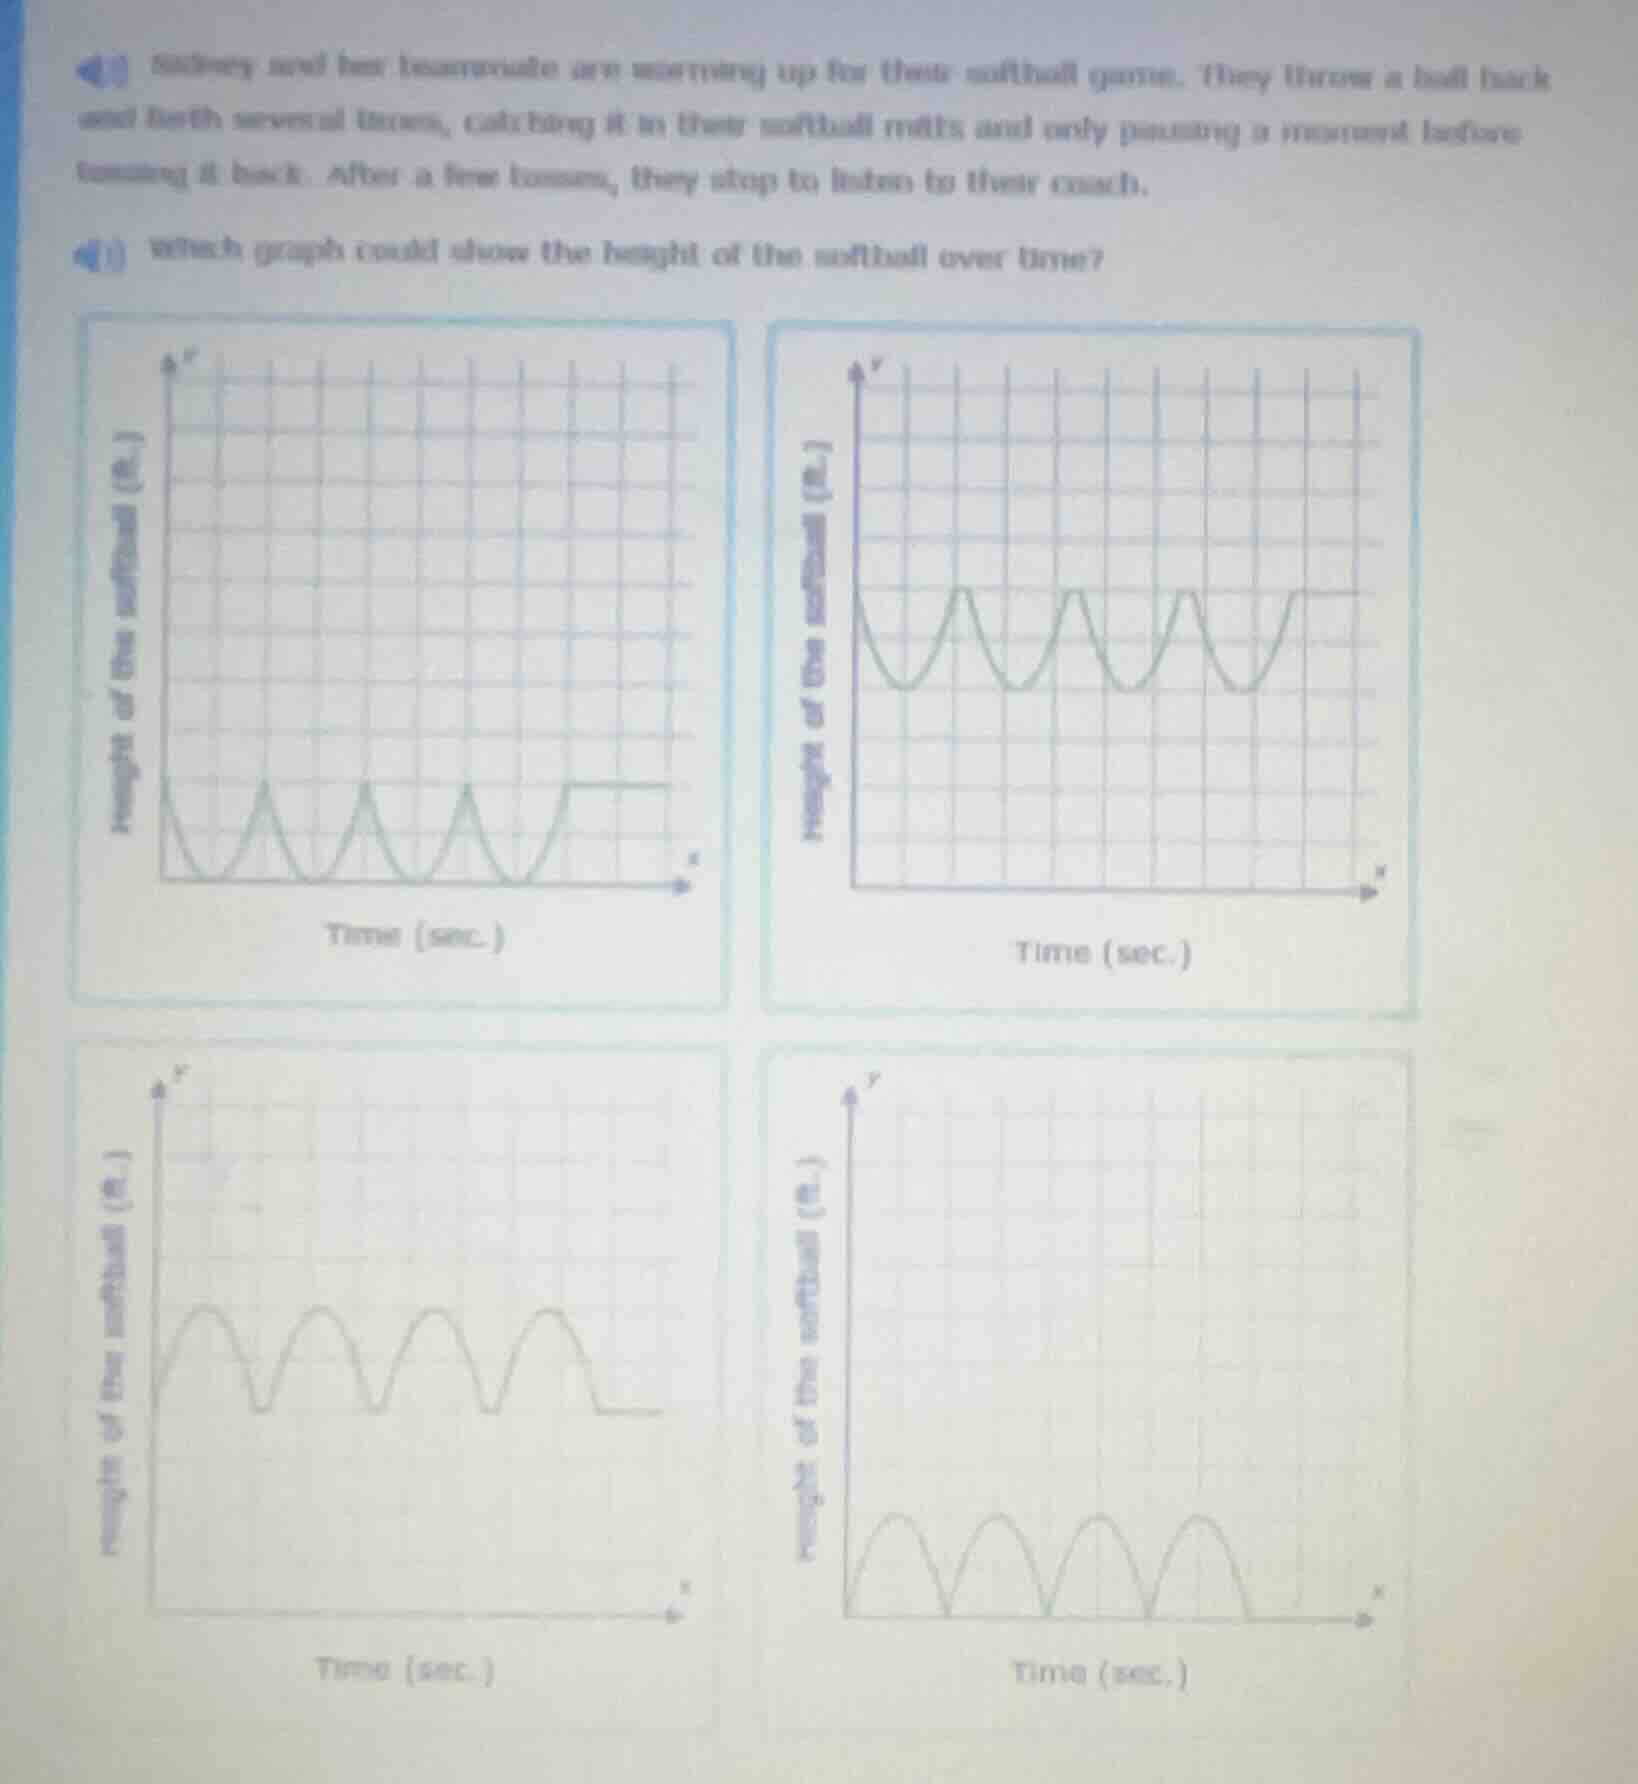
sidney and her teammates are warming up for their softball game. they throw a ball back and forth several times, catching it in their softball mitts and only pausing a moment before tossing it back. after a few tosses, they stop to listen to their coach.
which graph could show the height of the softball over time?
Brief Explanations
- When thrown, the softball's height rises to a peak, then falls as it travels to the other person.
- When caught, the ball is held for a moment, so its height stays constant (flat line) briefly before being thrown back.
- After several throws, they stop, so the final height becomes constant (flat line) when they stop moving the ball.
- The bottom-left graph matches this: it has rising/falling curves for throws, small flat segments for the brief pause when catching, and ends with a flat line when they stop to listen to the coach.

Snap & solve any problem in the app
Get step-by-step solutions on Sovi AI
Photo-based solutions with guided steps
Explore more problems and detailed explanations
The graph in the bottom-left corner (third graph, with peaks, small flat dips, and a final flat horizontal line)