QUESTION IMAGE
Question
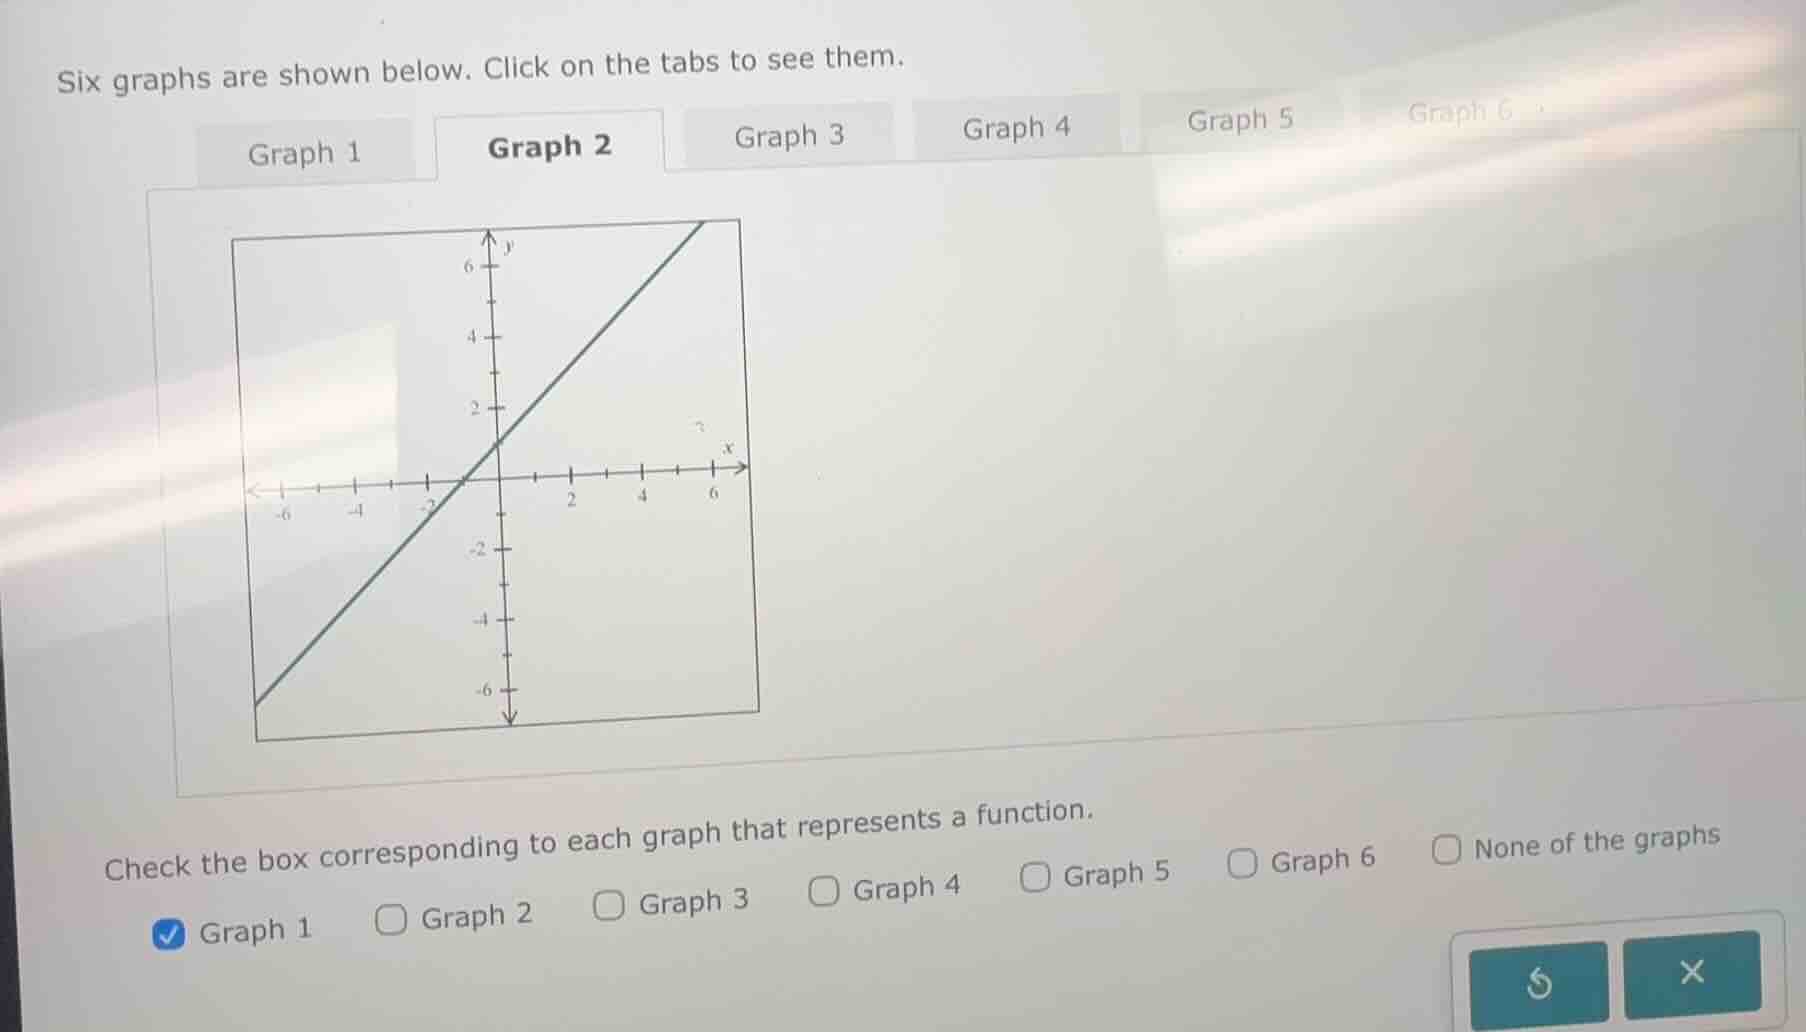
six graphs are shown below. click on the tabs to see them.
graph 1 graph 2 graph 3 graph 4 graph 5 graph 6
(graph 2s coordinate plane with a line)
check the box corresponding to each graph that represents a function.
graph 1 (checked) graph 2 (unchecked) graph 3 (unchecked) graph 4 (unchecked) graph 5 (unchecked) graph 6 (unchecked) none of the graphs (unchecked)
Step1: Recall the vertical line test
A graph represents a function if every vertical line intersects the graph at most once.
Step2: Analyze Graph 2
For Graph 2 (the line shown), we can apply the vertical line test. Any vertical line \( x = a \) will intersect the line \( y = mx + b \) (the form of a linear function) at exactly one point. So Graph 2 passes the vertical line test.

Snap & solve any problem in the app
Get step-by-step solutions on Sovi AI
Photo-based solutions with guided steps
Explore more problems and detailed explanations
Graph 2 should also be checked (the box next to Graph 2 should be selected) because it passes the vertical line test, meaning it represents a function.