QUESTION IMAGE
Question
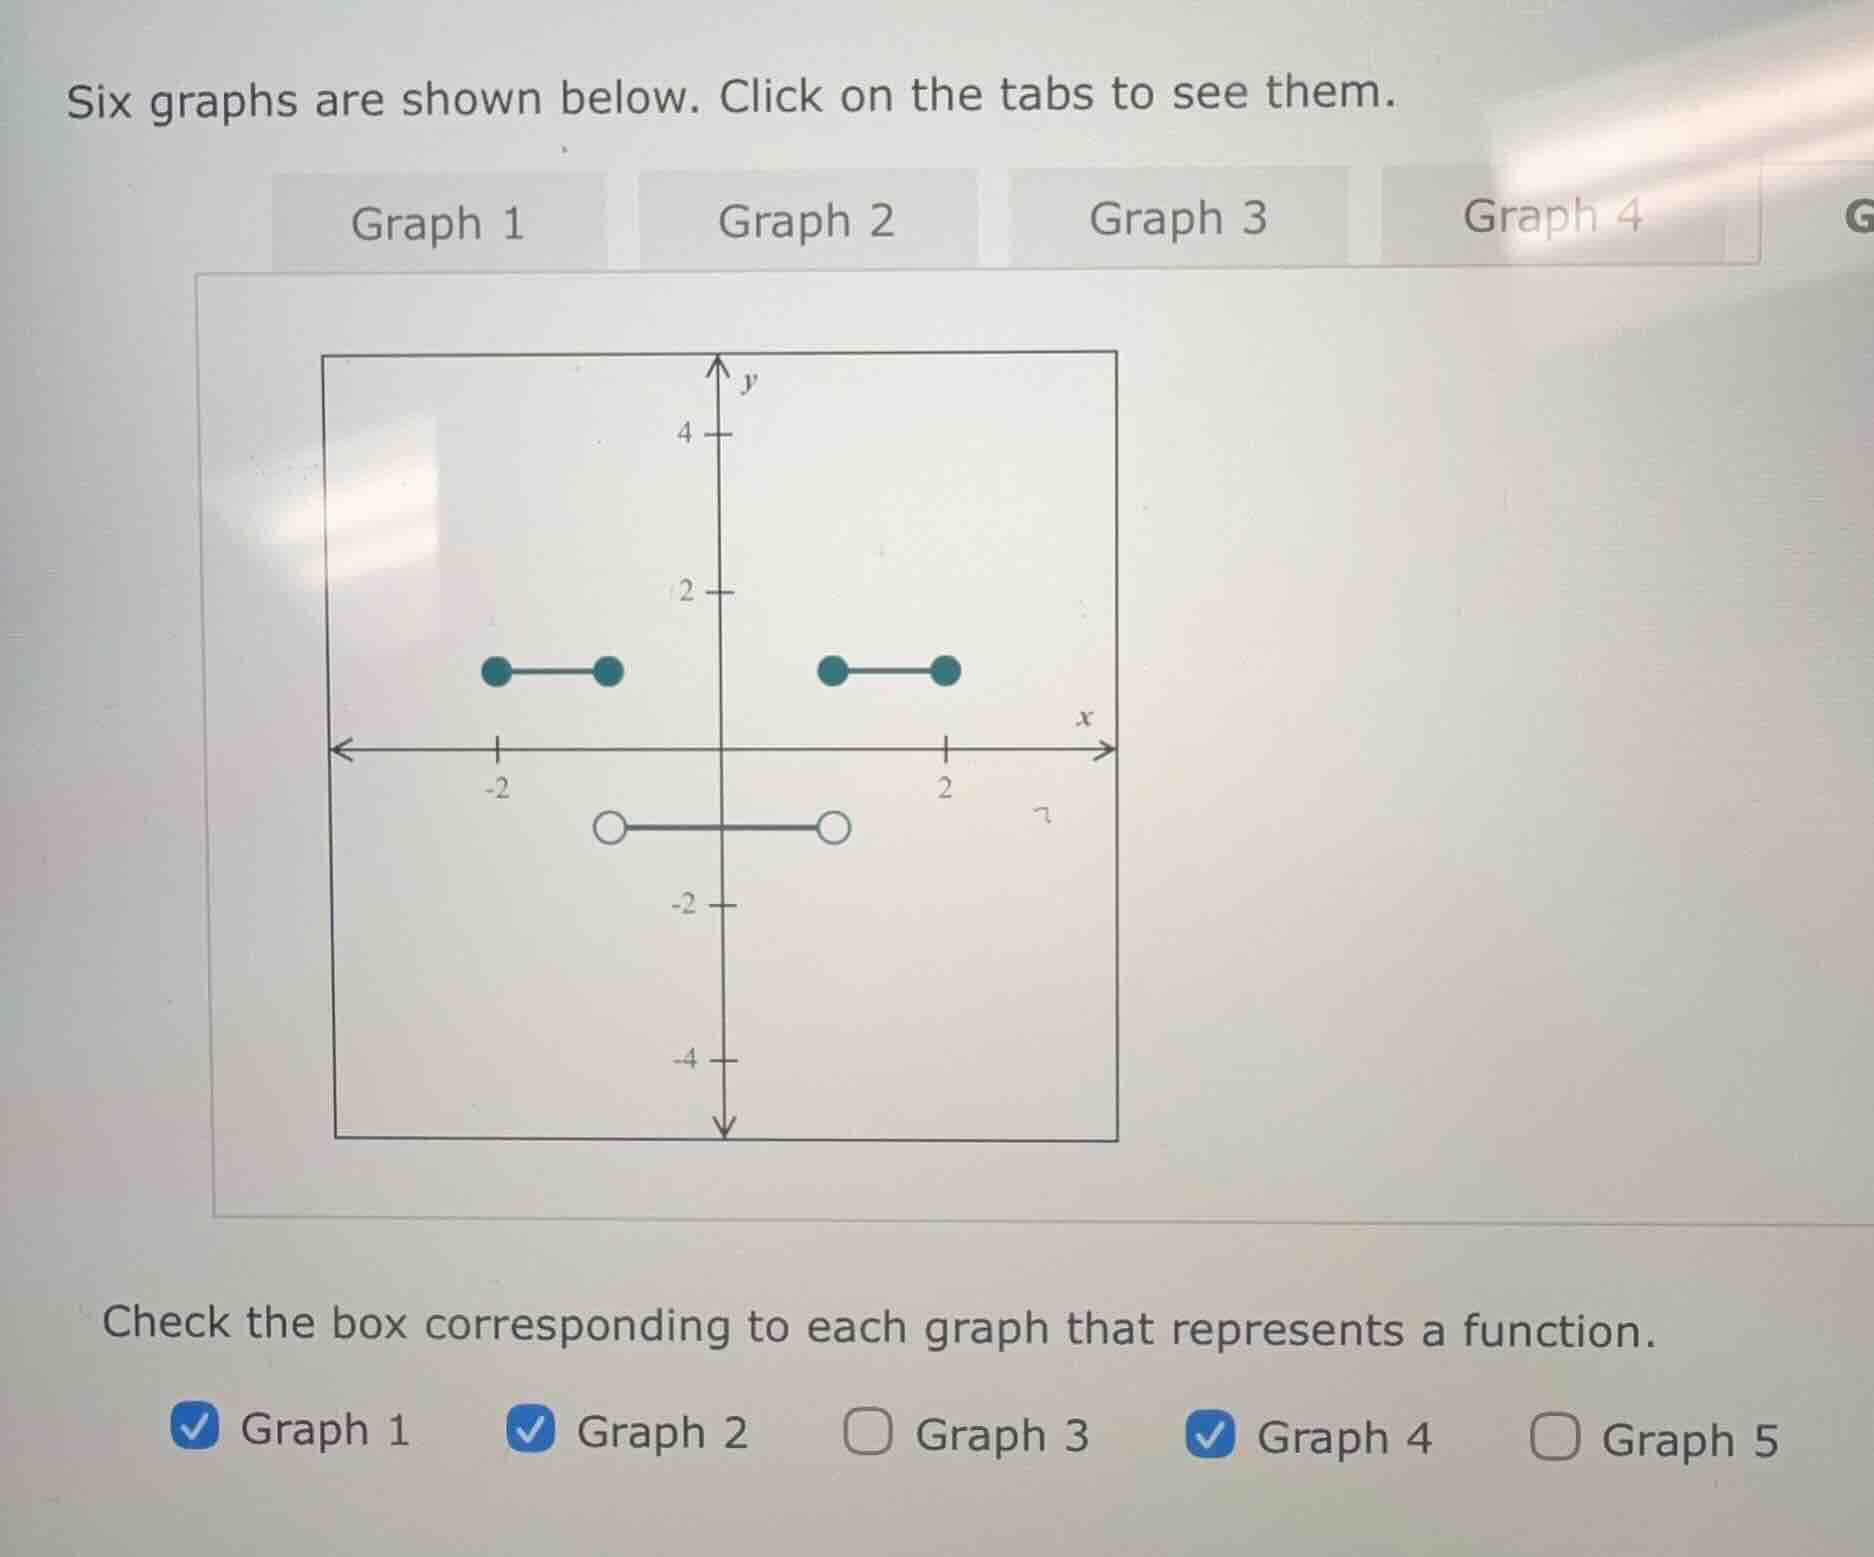
six graphs are shown below. click on the tabs to see them.
graph 1 graph 2 graph 3 graph 4
(graph 1 is shown: a coordinate plane with some line segments with endpoints as dots)
check the box corresponding to each graph that represents a function.
☑️ graph 1 ☑️ graph 2 ☐ graph 3 ☑️ graph 4 ☐ graph 5
To determine if a graph represents a function, we use the vertical line test: a graph is a function if no vertical line intersects the graph more than once.
Step 1: Analyze Graph 1
Looking at Graph 1, any vertical line will intersect it at most once. So it passes the vertical line test and is a function.
Step 2: Analyze Graph 2
For Graph 2, checking with vertical lines, each vertical line intersects the graph at most once. Thus, it passes the vertical line test and is a function.
Step 3: Analyze Graph 3
Graph 3 likely fails the vertical line test (e.g., a vertical line might intersect it more than once), so it is not a function (hence the unchecked box).
Step 4: Analyze Graph 4
Graph 4, when checked with vertical lines, has each vertical line intersecting at most once. So it passes the vertical line test and is a function.
Step 5: Analyze Graph 5
Graph 5 likely fails the vertical line test (a vertical line might intersect it more than once), so it is not a function (unchecked box).

Snap & solve any problem in the app
Get step-by-step solutions on Sovi AI
Photo-based solutions with guided steps
Explore more problems and detailed explanations
The graphs that represent functions are Graph 1, Graph 2, and Graph 4 (as indicated by the checked boxes: Graph 1, Graph 2, Graph 4).