QUESTION IMAGE
Question
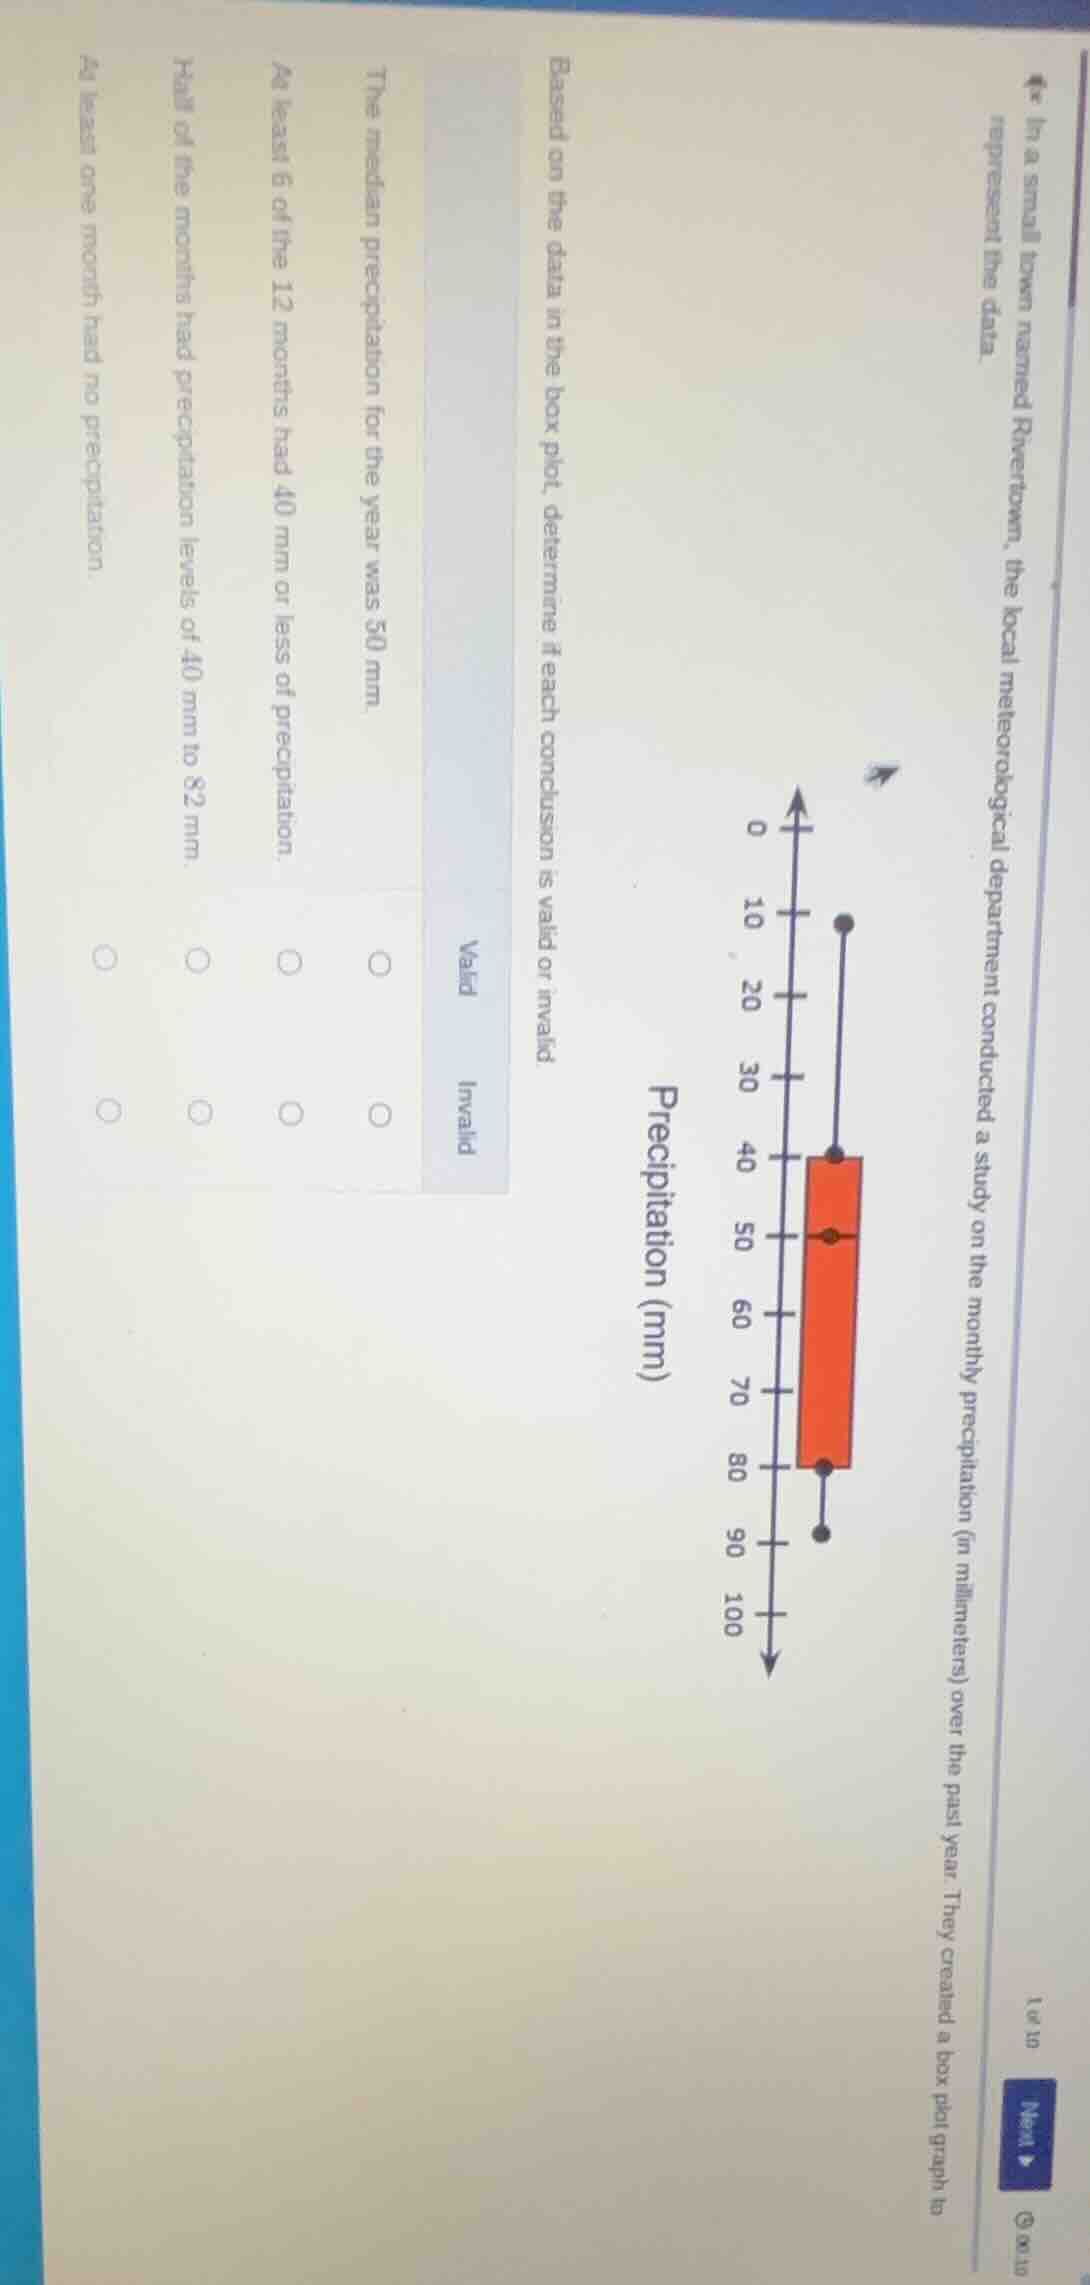
- in a small town named rivertown, the local meteorological department conducted a study on the monthly precipitation (in millimeters) over the past year. they created a box plot graph to represent the data. based on the data in the box plot, determine if each conclusion is valid or invalid. valid invalid the median precipitation for the year was 50 mm. at least 6 of the 12 months had 40 mm or less of precipitation. half of the months had precipitation levels of 40 mm to 82 mm. at least one month had no precipitation.
1. "The median precipitation for the year was 50 mm."
Step1: Recall box - plot median
In a box - plot, the line inside the box represents the median. From the given box - plot, the line inside the box is at 50 mm. So the median is 50 mm.
Step2: Determine validity
Since the median (the line in the box) is at 50 mm, the conclusion "The median precipitation for the year was 50 mm" is valid.
2. "At least 6 of the 12 months had 40 mm or less of precipitation."
Step1: Recall box - plot quartiles
In a box - plot, the left end of the box is the first quartile ($Q_1$). The first quartile represents the value where 25% of the data is less than or equal to it. Here, $Q_1 = 40$ mm. Since 25% of 12 months is $\frac{25}{100}\times12 = 3$ months. But we can also think in terms of the median (which splits the data into two halves). The data from the minimum to the median is 50% of the data. The first quartile is within the lower half. However, the key point is that the first quartile ($Q_1$) is 40 mm, which means that 25% of the data is less than or equal to 40 mm. 25% of 12 is 3, but we can also consider that the lower half (50% of 12 = 6 months) includes the data from the minimum to the median. The first quartile is part of the lower half. But actually, the first quartile is the 25th percentile. So the number of months with 40 mm or less is at least 25% of 12, which is 3, but if we consider the position of $Q_1$, the statement "at least 6 of the 12 months had 40 mm or less" is incorrect. Wait, no, let's re - evaluate. The box - plot: the minimum is around 10 mm, $Q_1 = 40$ mm, median = 50 mm, $Q_3=80$ mm, maximum = 90 mm. The data is divided into four parts: minimum - $Q_1$ (25% of data), $Q_1$ - median (25% of data), median - $Q_3$ (25% of data), $Q_3$ - maximum (25% of data). So the number of months with precipitation $\leq40$ mm is 25% of 12 = 3 months. So the statement "at least 6 of the 12 months had 40 mm or less of precipitation" is invalid. Wait, maybe I made a mistake. Let's think again. The median is the middle value. For 12 data points, the median is the average of the 6th and 7th values. The first quartile ($Q_1$) is the median of the first 6 values. So the first 6 values (the lower half) have a median of $Q_1 = 40$ mm. That means that at least 3 of the first 6 values are less than or equal to 40 mm (since the median of 6 values is the average of the 3rd and 4th). Wait, no, for 6 values, the median is the average of the 3rd and 4th. So if $Q_1 = 40$ mm, it means that the 3rd and 4th values (in the lower half) average to 40. So at least 3 of the first 6 values (lower half) are less than or equal to 40, and the other 3 are between 40 and 50. So the total number of months with 40 mm or less is at least 3, not 6. So the statement is invalid.
3. "Half of the months had precipitation levels of 40 mm to 82 mm."
Step1: Recall box - plot quartiles
The box in the box - plot goes from $Q_1 = 40$ mm to $Q_3=80$ mm (wait, the right end of the box is 80 mm? Wait, in the plot, the right end of the box is at 80 mm? Wait, the user's plot: the box is from 40 to 80, median at 50. Wait, maybe I misread earlier. Let's re - examine. The box is from 40 (left end) to 80 (right end), median at 50. The first quartile ($Q_1$) is 40, the third quartile ($Q_3$) is 80. The inter - quartile range (IQR) is $Q_3 - Q_1=80 - 40 = 40$. The data between $Q_1$ and $Q_3$ represents 50% of the data (since $Q_1$ is the 25th percentile and $Q_3$ is the 75th percentile, so 75% - 25% = 50% of the data is between $Q_1$ and $Q_3$). 50% of 12 months is 6 months. So the number of months with precipitation between 40 mm and 80 mm (close to 82, maybe a typo, and 80 is the $Q_3$) is 50% of 12 = 6 months. So the statement "Half of the months had precipitation levels of 40 mm to 82 mm" is valid (since 82 is close to 80, and the third quartile is 80, so the data between 40 and 80 is 50% of the data, and 82 is just a bit above 80, so we can consider that half of the months (6 months) had precipitation between 40 and 82 mm).
4. "At least one month had no precipitation."

Snap & solve any problem in the app
Get step-by-step solutions on Sovi AI
Photo-based solutions with guided steps
Explore more problems and detailed explanations
s:
- "The median precipitation for the year was 50 mm." : Valid
- "At least 6 of the 12 months had 40 mm or less of precipitation." : Invalid
- "Half of the months had precipitation levels of 40 mm to 82 mm." : Valid
- "At least one month had no precipitation." : Invalid