QUESTION IMAGE
Question
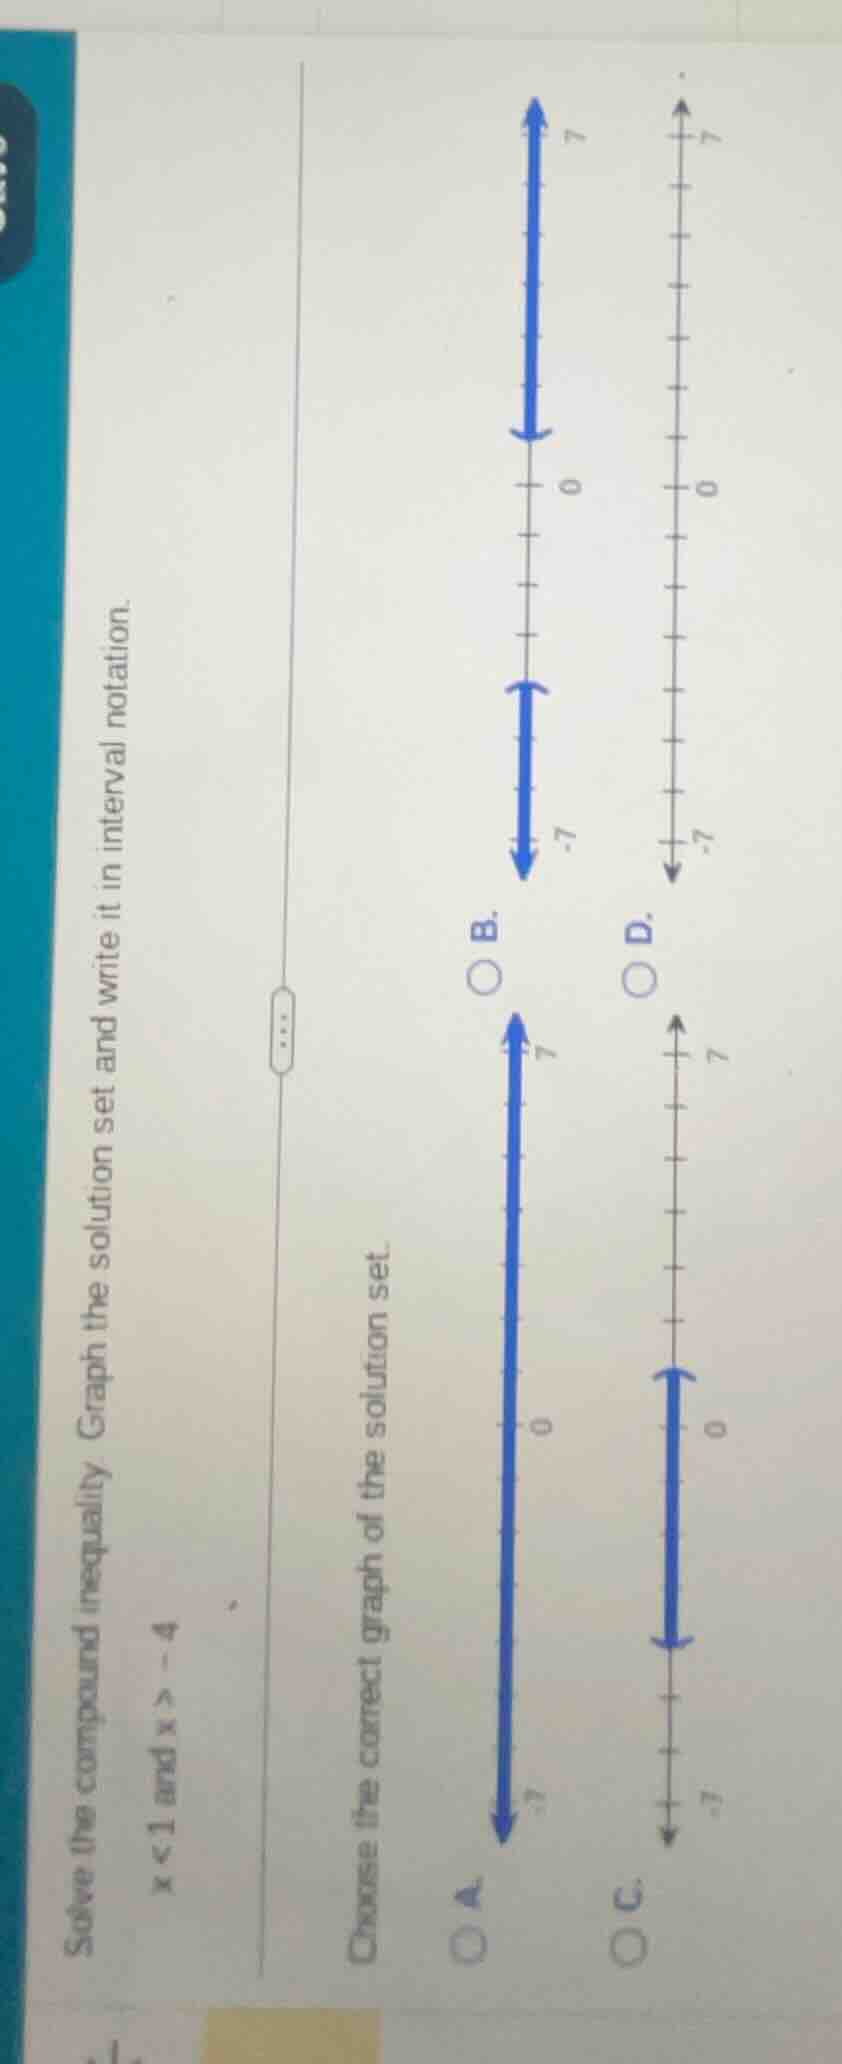
solve the compound inequality. graph the solution set and write it in interval notation.
$x < 1$ and $x > -4$
choose the correct graph of the solution set.
Step1: Analyze the compound inequality
We have the compound inequality \( x < 1 \) and \( x > - 4 \). This means we are looking for all real numbers \( x \) that are greater than - 4 and less than 1. In interval notation, this is written as \( (-4,1) \).
Step2: Analyze the number line graphs
- For option A: The graph shows all real numbers (extending to \( -\infty \) and \( +\infty \)), which does not match our solution.
- For option B: The graph shows two separate intervals (less than - 7 and greater than 0), which does not match our solution.
- For option C: The graph shows all real numbers from \( -\infty \) to \( +\infty \), which is incorrect.
- For option D: Wait, let's re - evaluate. Wait, actually, the correct graph for \( - 4
-4 \), not \( x\geq - 4 \)) and an open circle at 1 (since \( x < 1 \), not \( x\leq1 \)) and a line connecting them. But looking at the options, maybe there was a typo in the original problem's option labels. Wait, the correct interval for \( x < 1 \) and \( x>-4 \) is \( (-4,1) \). The graph that represents this should have a segment between - 4 and 1 with open circles at both ends. Among the given options, if we assume that the correct graph is the one that shows the interval between - 4 and 1 (even if the number line labels were misprinted as - 7 and 7, maybe it's a scaling issue). So the correct graph should be the one that has a line between - 4 and 1 (represented as between - 7 and 7 in the options, maybe a mislabel) with open circles. But based on the interval notation \( (-4,1) \), the correct graph (assuming the number line is mislabeled in the options) and the interval notation is \( (-4,1) \).

Snap & solve any problem in the app
Get step-by-step solutions on Sovi AI
Photo-based solutions with guided steps
Explore more problems and detailed explanations
The solution of the compound inequality \( x < 1 \) and \( x>-4 \) in interval notation is \( (-4,1) \). The correct graph (assuming the number line labels are misprinted and should represent - 4 and 1 instead of - 7 and 7) is the one that shows the interval between - 4 and 1 with open circles at both ends (corresponding to the option that has a segment between the two points with open circles, likely the one similar to option D if we consider the mislabeling, but the interval notation is \( (-4,1) \)).