QUESTION IMAGE
Question
for some question you will be able to graph your answer. use the dot tool to place points, and the appropriate graphing tool for lines and curves.
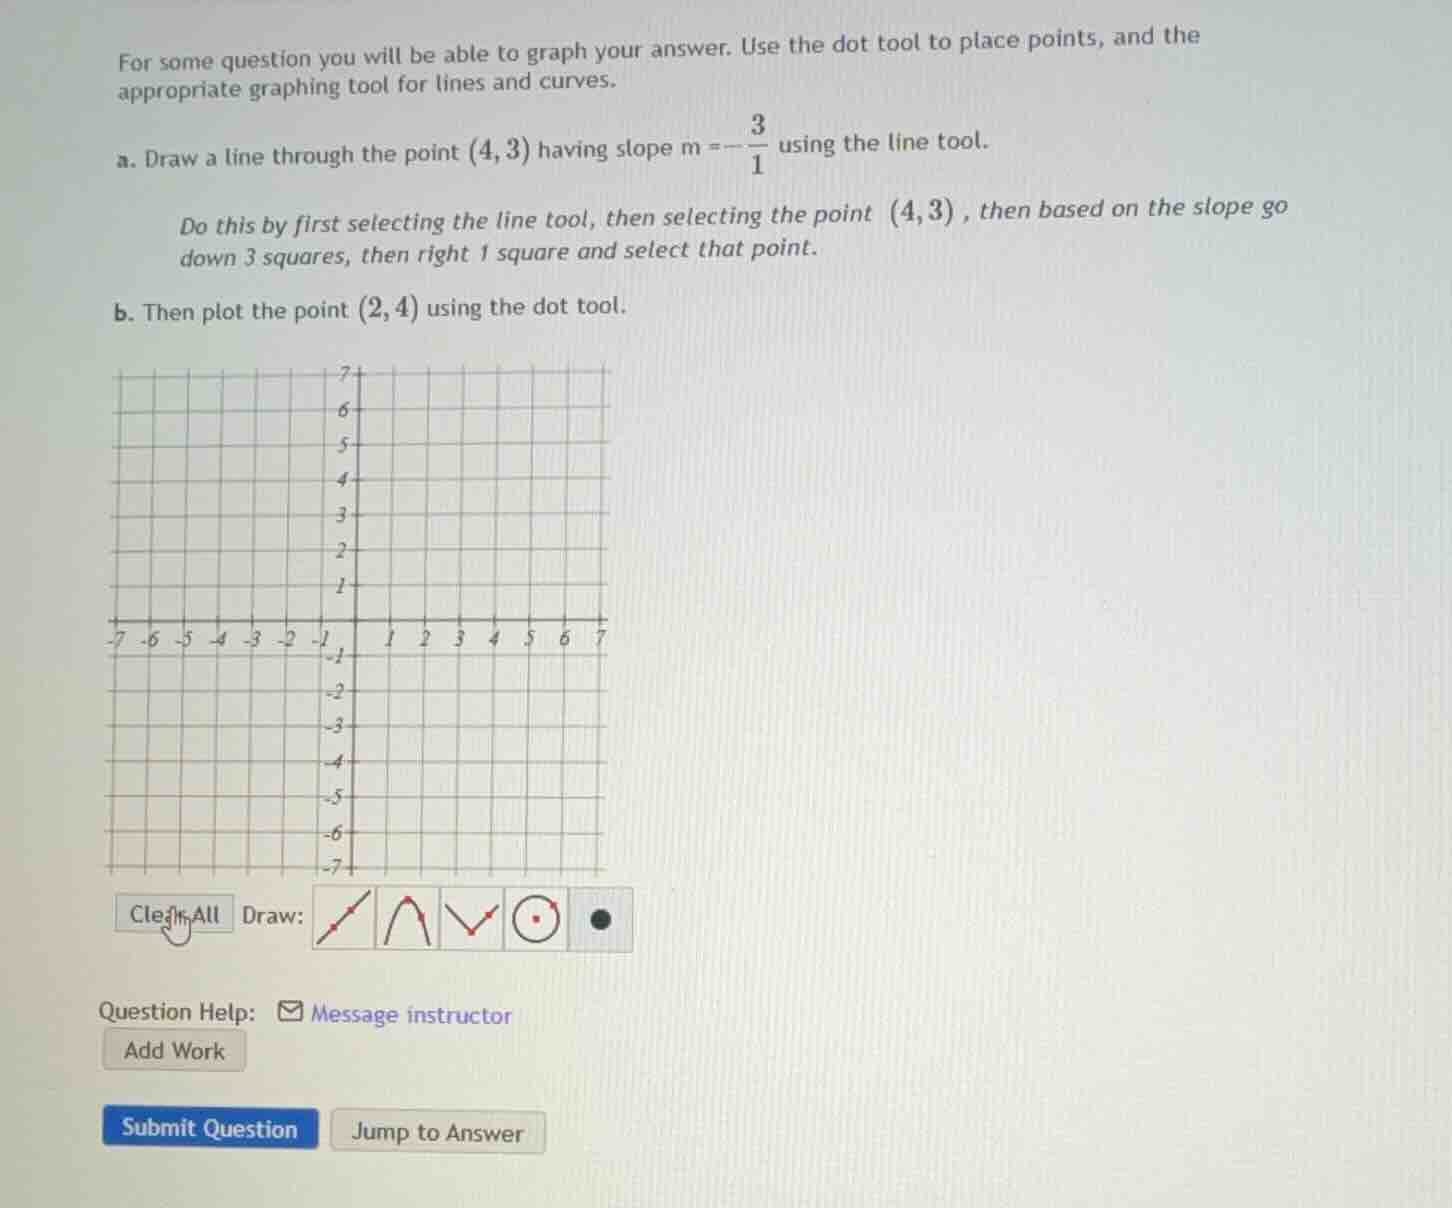
a. draw a line through the point (4,3) having slope m = -\frac{3}{1} using the line tool.
do this by first selecting the line tool, then selecting the point (4,3), then based on the slope go down 3 squares, then right 1 square and select that point.
b. then plot the point (2,4) using the dot tool.
graph with grid and drawing tools
question help: message instructor
add work
submit question jump to answer
Step1: Graph the line through (4,3) with slope -3/1
Start at the point (4, 3). The slope \( m = -\frac{3}{1} \) means for every 1 unit we move to the right (positive x - direction), we move 3 units down (negative y - direction). So from (4, 3), moving right 1 unit (to x = 5) and down 3 units (to y = 3 - 3 = 0) gives us the point (5, 0). We can also move left 1 unit (to x = 3) and up 3 units (to y = 3+3 = 6) to get the point (3, 6). Then we can draw a line connecting these points (or using the initial point and one of these derived points) using the line tool.
Step2: Plot the point (2,4)
Using the dot tool, we locate the x - coordinate 2 on the x - axis and the y - coordinate 4 on the y - axis. The intersection of the vertical line through x = 2 and the horizontal line through y = 4 is the point (2, 4), and we place a dot there.
(Note: Since this is a graphing problem, the final answer is the visual representation of the line through (4,3) with slope - 3 and the dot at (2,4) on the given coordinate plane. If we were to describe the key points for the line: starting at (4,3), another point can be (5,0) or (3,6), and the point (2,4) is plotted separately.)

Snap & solve any problem in the app
Get step-by-step solutions on Sovi AI
Photo-based solutions with guided steps
Explore more problems and detailed explanations
- For part a: The line passes through (4, 3) and (5, 0) (or (3, 6)) and is drawn using the line tool.
- For part b: The point (2, 4) is plotted using the dot tool.