QUESTION IMAGE
Question
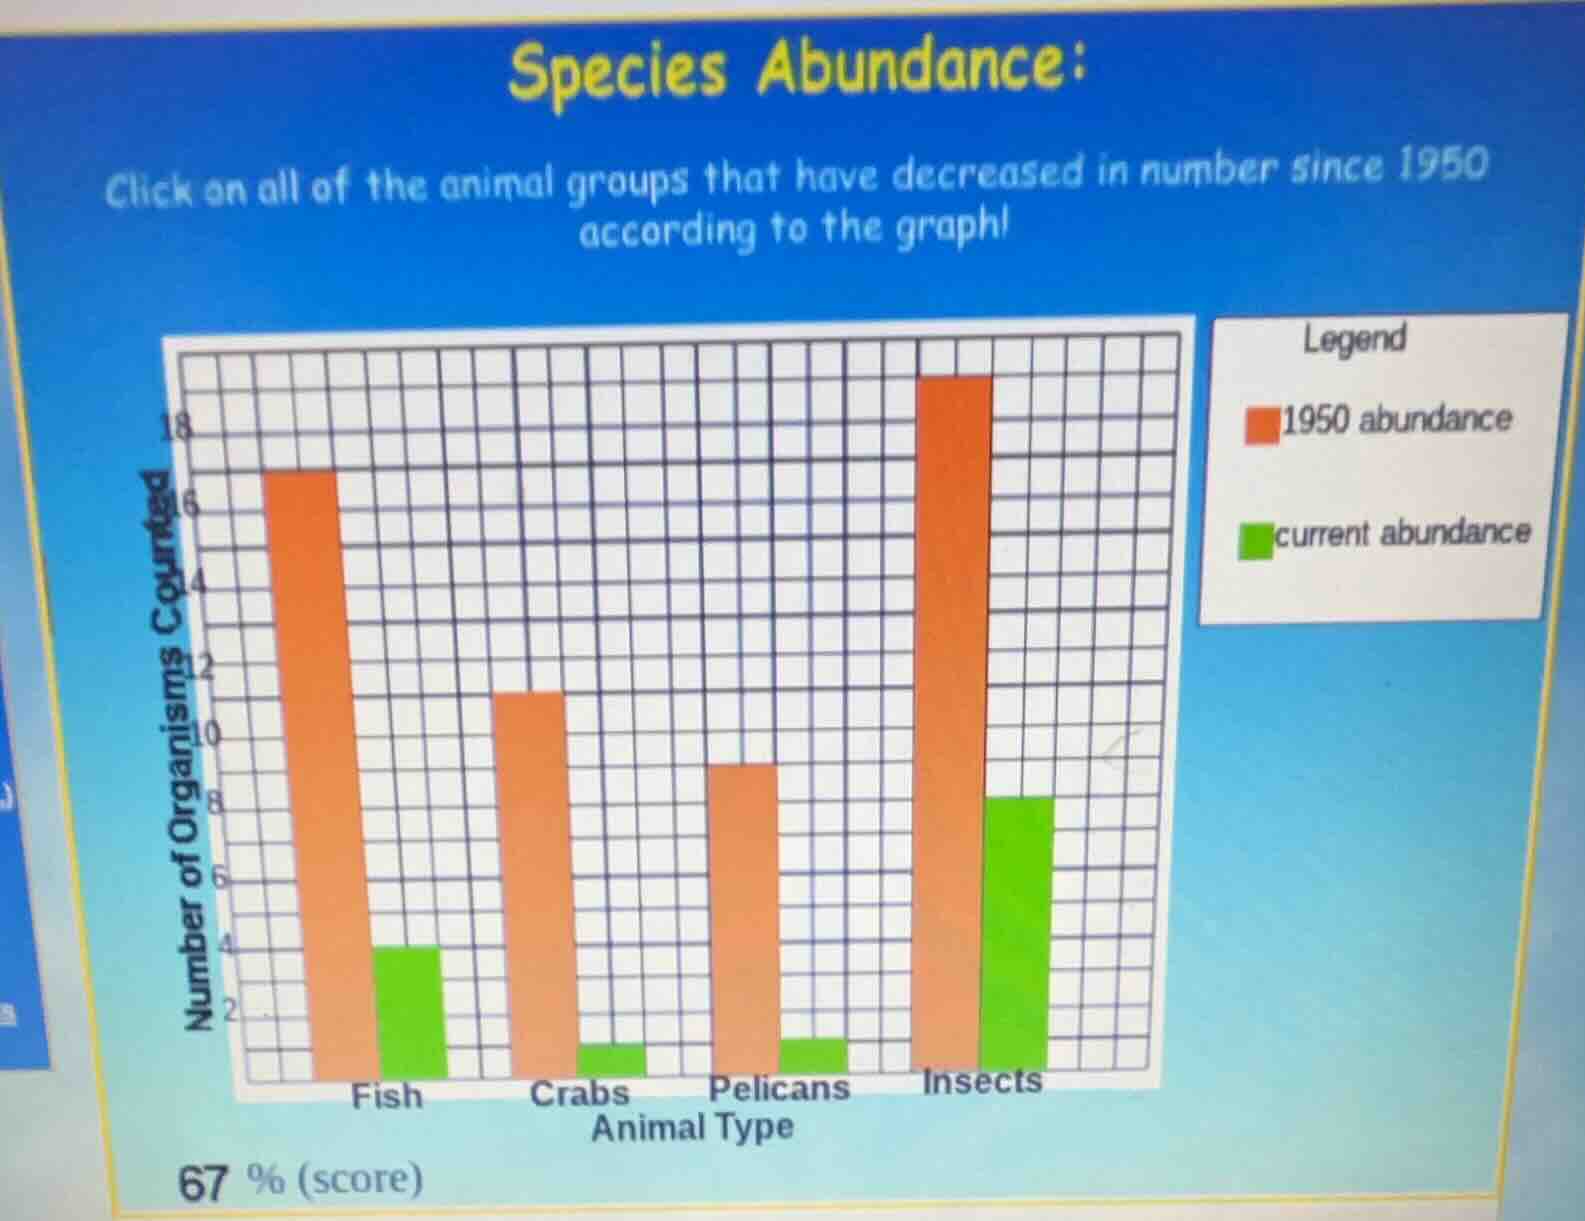
species abundance:
click on all of the animal groups that have decreased in number since 1950 according to the graph!
legend
1950 abundance
current abundance
number of organisms counted
fish crabs pelicans insects
animal type
67 % (score)
To determine which animal groups have decreased since 1950, we compare the orange (1950) and green (current) bars for each group:
- Fish: 1950 bar (≈17) > current bar (≈4) → decreased.
- Crabs: 1950 bar (≈11) > current bar (≈1) → decreased.
- Pelicans: 1950 bar (≈9) > current bar (≈1) → decreased.
- Insects: 1950 bar (≈20) > current bar (≈8) → decreased? Wait, no—wait, the green bar for Insects is ~8, orange is ~20? Wait, no, looking at the graph: Fish (orange tall, green short), Crabs (orange tall, green short), Pelicans (orange tall, green short), Insects (orange very tall, green shorter but not as short as others? Wait, no, the y - axis: Fish orange is ~17, green ~4; Crabs orange ~11, green ~1; Pelicans orange ~9, green ~1; Insects orange ~20, green ~8. So all except maybe? Wait, the question is "all of the animal groups that have decreased". So Fish, Crabs, Pelicans, Insects? Wait, no—wait, the green bar for Insects is lower than orange, so yes, decreased. Wait, but maybe I misread. Wait, the graph:
- Fish: 1950 (orange) is higher than current (green) → decreased.
- Crabs: 1950 higher than current → decreased.
- Pelicans: 1950 higher than current → decreased.
- Insects: 1950 higher than current → decreased.
Wait, but maybe the original graph—wait, the user's graph: let's re - examine. The y - axis is "Number of Organisms Counted". For Fish: orange (1950) is around 17, green (current) around 4 → decrease. Crabs: orange ~11, green ~1 → decrease. Pelicans: orange ~9, green ~1 → decrease. Insects: orange ~20, green ~8 → decrease. So all four? But maybe the initial score was 67%, meaning some were missed. Wait, maybe I made a mistake. Wait, the legend: red is 1950, green is current. So for each animal, if green < red, then decreased.
Fish: red > green → yes.
Crabs: red > green → yes.
Pelicans: red > green → yes.
Insects: red > green → yes.
Wait, but maybe the intended answer is Fish, Crabs, Pelicans, Insects? Or maybe Insects is not? Wait, no, the green bar for Insects is lower than red, so it's a decrease. So the animal groups are Fish, Crabs, Pelicans, Insects.

Snap & solve any problem in the app
Get step-by-step solutions on Sovi AI
Photo-based solutions with guided steps
Explore more problems and detailed explanations
Fish, Crabs, Pelicans, Insects