QUESTION IMAGE
Question
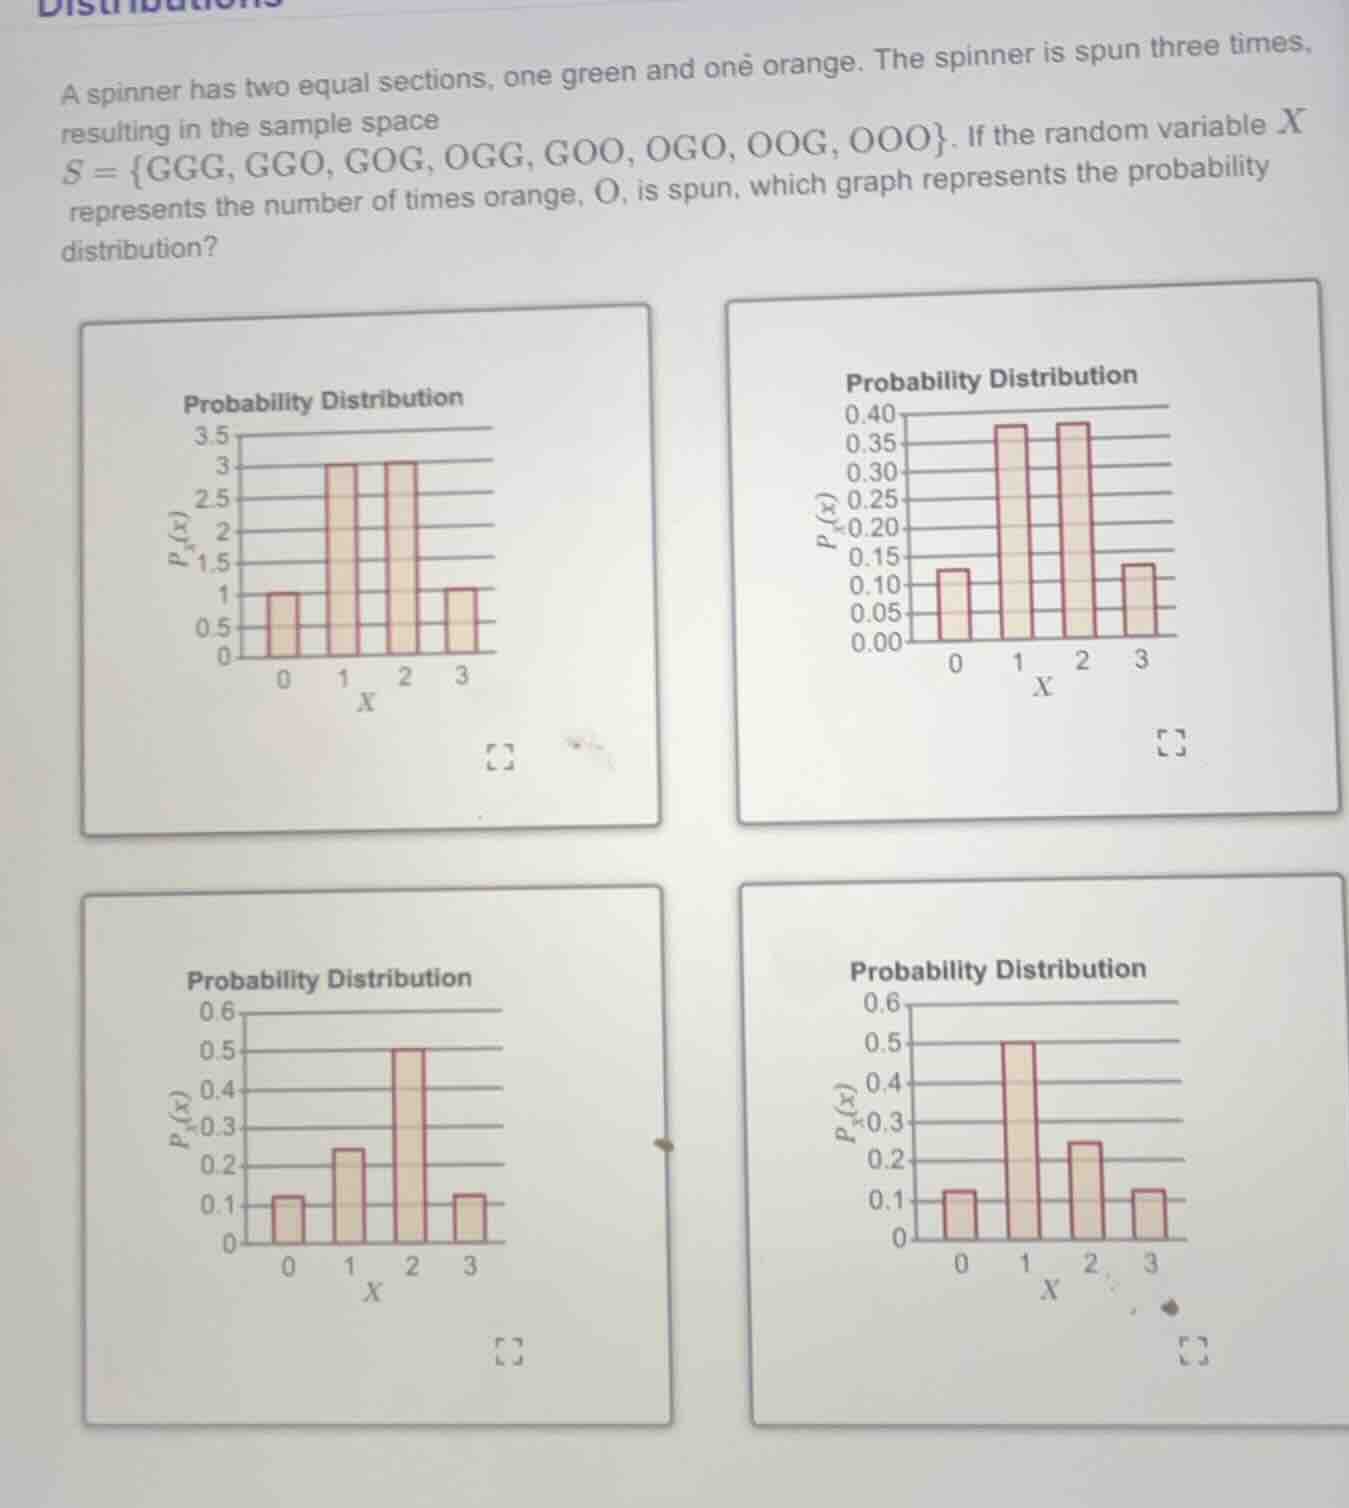
a spinner has two equal sections, one green and one orange. the spinner is spun three times, resulting in the sample space s = {ggg, ggo, gog, ogg, goo, ogo, oog, ooo}. if the random variable x represents the number of times orange, o, is spun, which graph represents the probability distribution? four probability distribution bar graphs are shown, with x - axis labeled 0, 1, 2, 3 and y - axis labeled p_x(x) or similar probability - related labels for each graph
Step1: Determine possible values of \( X \)
The spinner is spun 3 times, so \( X \) (number of orange spins) can be 0, 1, 2, or 3.
Step2: Calculate probabilities for each \( X \)
- \( X = 0 \) (all green): Only 1 outcome (GGG) in sample space \( S \) (size 8). So \( P(X=0) = \frac{1}{8} = 0.125 \).
- \( X = 1 \) (one orange): Outcomes are GGO, GOG, OGG. So 3 outcomes. \( P(X=1) = \frac{3}{8} = 0.375 \).
- \( X = 2 \) (two oranges): Outcomes are GOO, OGO, OOG. So 3 outcomes. \( P(X=2) = \frac{3}{8} = 0.375 \).
- \( X = 3 \) (all orange): Only 1 outcome (OOO). \( P(X=3) = \frac{1}{8} = 0.125 \).
Step3: Match with graphs
The probabilities are \( P(0)=0.125 \), \( P(1)=0.375 \), \( P(2)=0.375 \), \( P(3)=0.125 \). The second graph (top - right) has heights ~0.125, ~0.375, ~0.375, ~0.125, matching these probabilities.

Snap & solve any problem in the app
Get step-by-step solutions on Sovi AI
Photo-based solutions with guided steps
Explore more problems and detailed explanations
The top - right probability distribution graph (with \( P(X) \) values ~0.125 for \( X = 0 \) and \( X = 3 \), ~0.375 for \( X = 1 \) and \( X = 2 \)) represents the probability distribution.