QUESTION IMAGE
Question
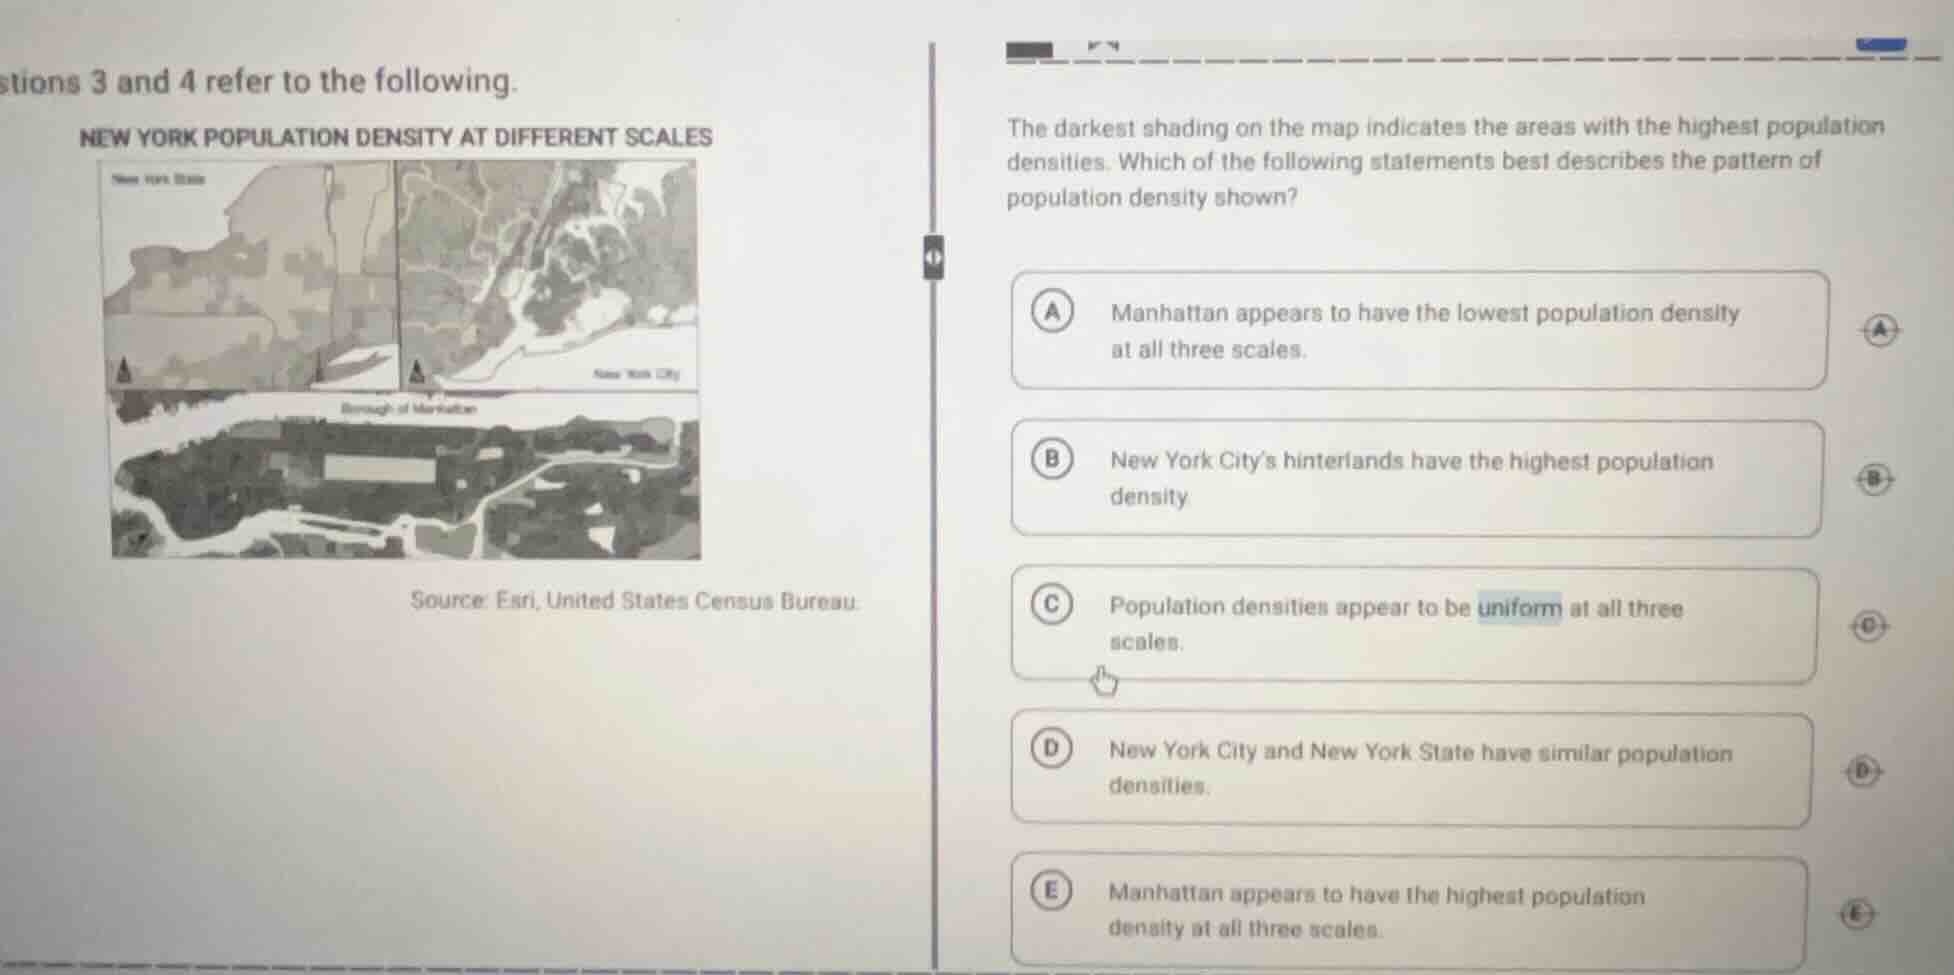
stions 3 and 4 refer to the following.
new york population density at different scales
source: esri, united states census bureau.
the darkest shading on the map indicates the areas with the highest population densities. which of the following statements best describes the pattern of population density shown?
a manhattan appears to have the lowest population density at all three scales.
b new york city’s hinterlands have the highest population density
c population densities appear to be uniform at all three scales.
d new york city and new york state have similar population densities.
e manhattan appears to have the highest population density at all three scales.
To solve this, we analyze each option:
- Option A: Manhattan is a highly populated area, so it can't have the lowest density. Eliminate A.
- Option B: Hinterlands (rural areas around a city) typically have lower population density than the city center (like Manhattan). Eliminate B.
- Option C: Population density varies across areas (e.g., Manhattan vs. rural NY), so it's not uniform. Eliminate C.
- Option D: New York City (especially Manhattan) has much higher density than the state (which includes rural areas). Eliminate D.
- Option E: Manhattan is a densely populated borough of NYC, and at different scales (state, city, borough), it shows the highest density (darkest shading) compared to surrounding areas. This matches the population density pattern.

Snap & solve any problem in the app
Get step-by-step solutions on Sovi AI
Photo-based solutions with guided steps
Explore more problems and detailed explanations
E. Manhattan appears to have the highest population density at all three scales.