QUESTION IMAGE
Question
study the graph.
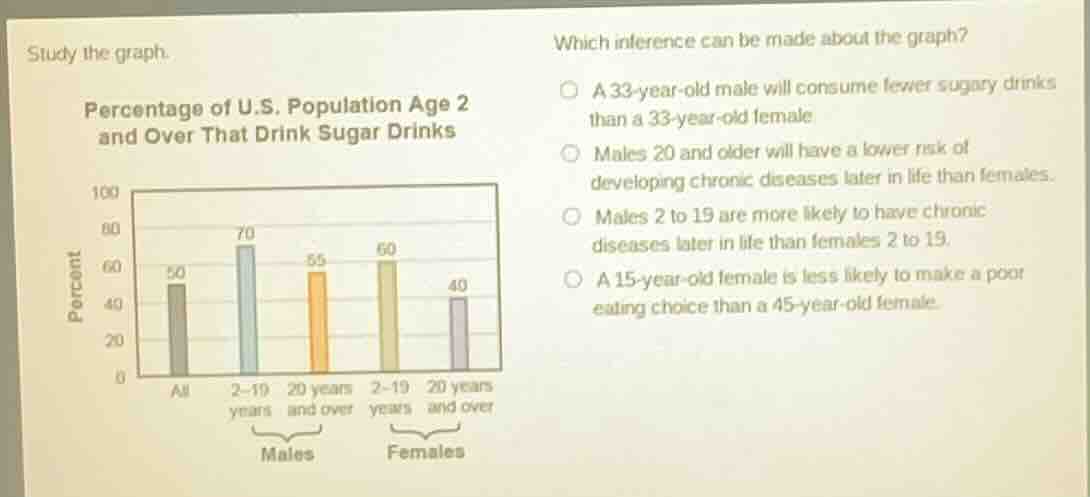
percentage of u.s. population age 2 and over that drink sugar drinks
which inference can be made about the graph?
a 33 - year - old male will consume fewer sugary drinks than a 33 - year - old female
males 20 and older will have a lower risk of developing chronic diseases later in life than females.
males 2 to 19 are more likely to have chronic diseases later in life than females 2 to 19.
a 15 - year - old female is less likely to make a poor eating choice than a 45 - year - old female.
- For option A: The graph doesn't have data for 33 - year - olds, so we can't make this inference.
- For option B: The graph shows the percentage of people drinking sugar drinks, not the risk of chronic diseases directly. Also, males 20 and over (55%) drink sugary drinks at a lower rate than females 20 and over (40%)? Wait, no, the male 20 and over bar is 55, female 20 and over is 40. Wait, actually, higher sugar drink consumption is associated with higher chronic disease risk (generally). But the option says males 20 and older have lower risk, but males 20 and over have higher sugar drink consumption (55 vs 40 for females 20 and over), so this is incorrect.
- For option C: Males 2 - 19 (70%) drink sugary drinks at a higher rate than females 2 - 19 (60%). Higher sugar drink consumption is associated with a higher risk of chronic diseases later in life, so males 2 - 19 are more likely to have chronic diseases later, this is correct.
- For option D: The graph has no data on 15 - year - old or 45 - year - old females specifically, and also no data on "poor eating choices" beyond sugar drinks (and we don't know if sugar drink is the only poor eating choice here), so we can't make this inference.

Snap & solve any problem in the app
Get step-by-step solutions on Sovi AI
Photo-based solutions with guided steps
Explore more problems and detailed explanations
C. Males 2 to 19 are more likely to have chronic diseases later in life than females 2 to 19.