QUESTION IMAGE
Question
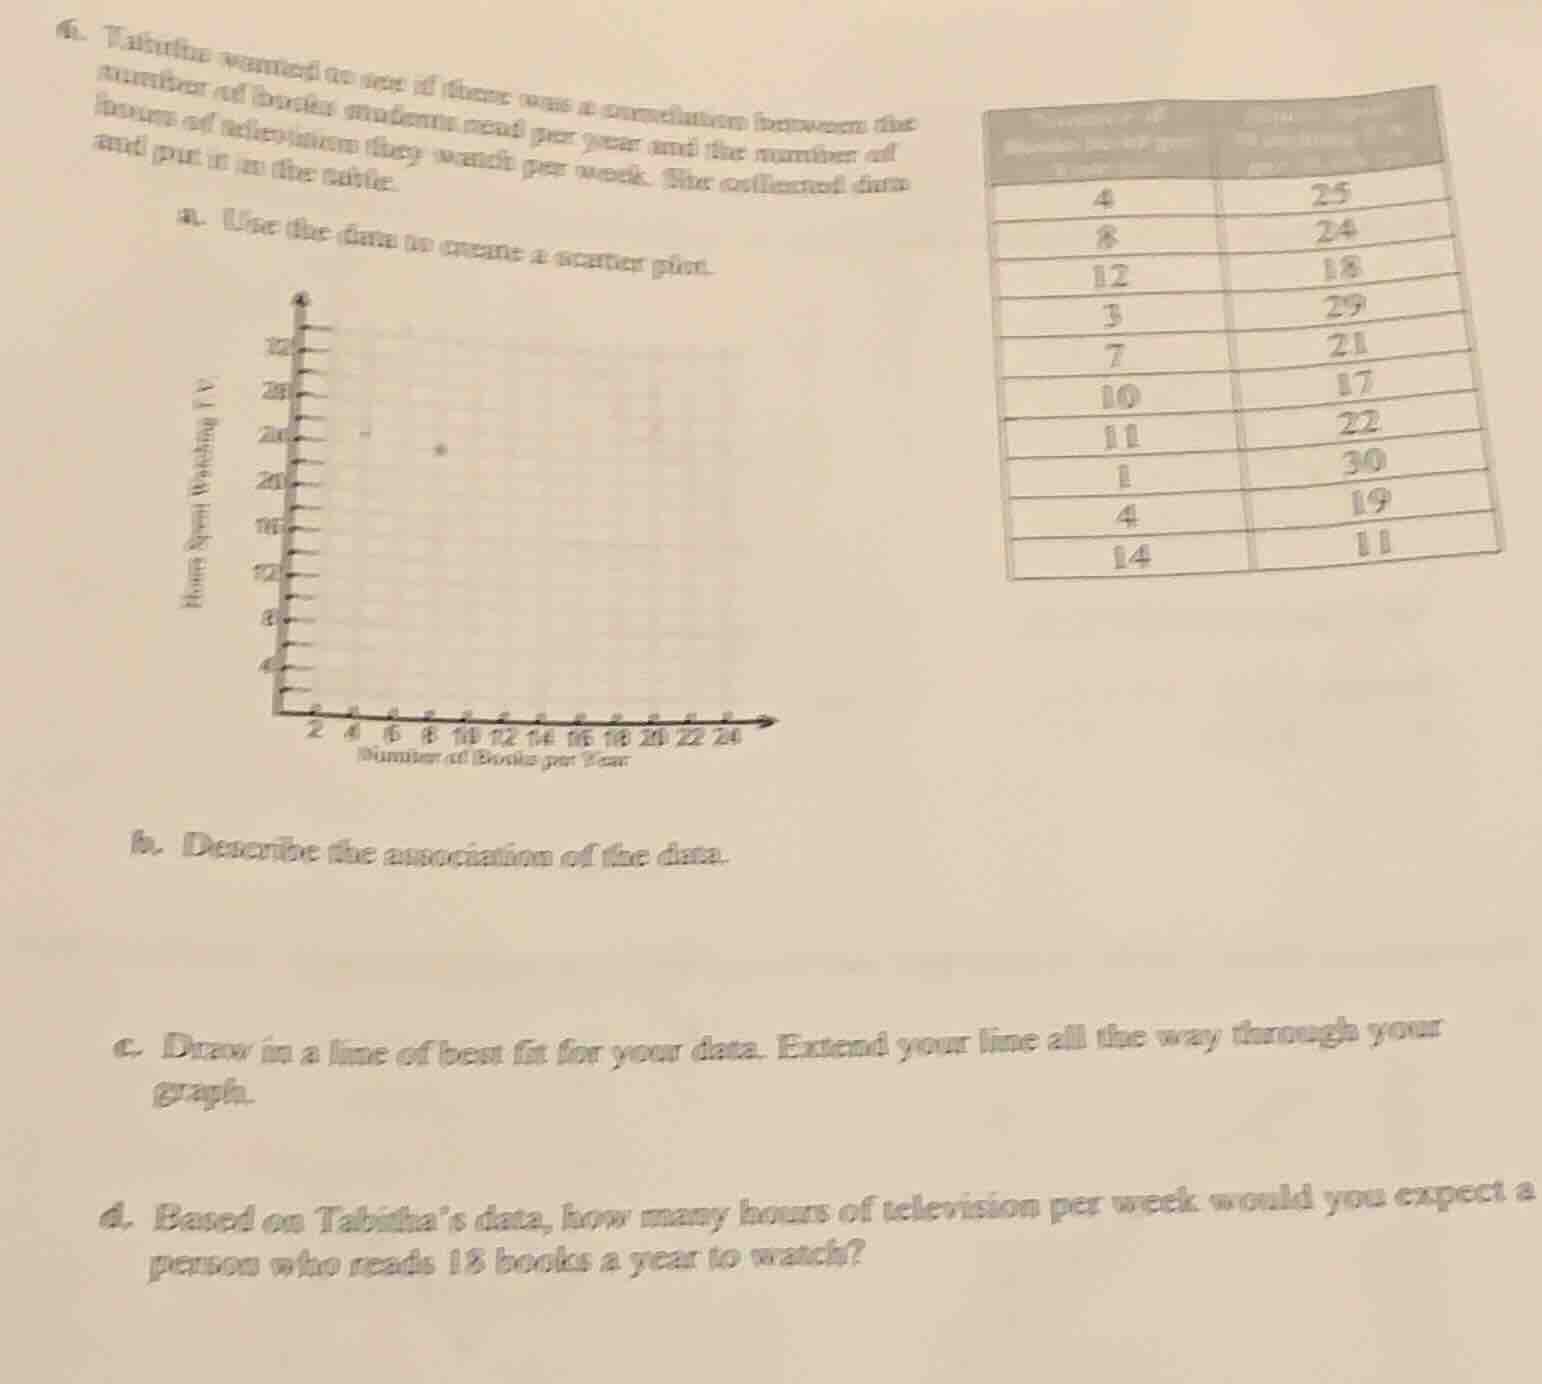
- tabitha wanted to see if there was a correlation between the number of books students read per year and the number of hours of television they watch per week. she collected data and put it in the table.
a. use the data to create a scatter plot.
b. describe the association of the data.
c. draw in a line of best fit for your data. extend your line all the way through your graph.
d. based on tabithas data, how many hours of television per week would you expect a person who reads 18 books a year to watch?
| number of books read per year | hours spent watching tv per week | ---- | ---- | 4 | 25 | 8 | 24 | 12 | 18 | 3 | 29 | 7 | 21 | 10 | 17 | 11 | 22 | 1 | 30 | 4 | 19 | 14 | 11 |
Step1: Plot data points
Plot each pair (Number of Books, Hours of TV) as coordinates on the scatter plot:
(4,25), (8,24), (12,18), (3,29), (7,21), (10,17), (11,22), (1,30), (4,19), (14,11)
Step2: Describe data association
Observe the trend of plotted points: as the number of books increases, TV hours decrease, with points clustered closely to a downward slope.
Step3: Draw line of best fit
Sketch a straight line that passes near most data points, extending from the top-left to bottom-right of the plot (e.g., passing through (2,30) and (14,11)).
Step4: Predict TV hours for 18 books
Use the line of best fit trend: calculate the slope $m=\frac{11-30}{14-2}=\frac{-19}{12}\approx-1.58$. Use point-slope form $y-30=-1.58(x-2)$. Substitute $x=18$:
$y=30 -1.58(18-2)=30-1.58\times16=30-25.28=4.72$
Round to a reasonable whole number.

Snap & solve any problem in the app
Get step-by-step solutions on Sovi AI
Photo-based solutions with guided steps
Explore more problems and detailed explanations
a. Scatter plot with points: (4,25), (8,24), (12,18), (3,29), (7,21), (10,17), (11,22), (1,30), (4,19), (14,11) plotted on the provided axes.
b. There is a strong, negative linear association: as the number of books read per year increases, the weekly hours of television watched decreases consistently.
c. A straight line extending from the upper left (low books, high TV) to lower right (high books, low TV), passing near most data points.
d. Approximately 5 hours of television per week.