QUESTION IMAGE
Question
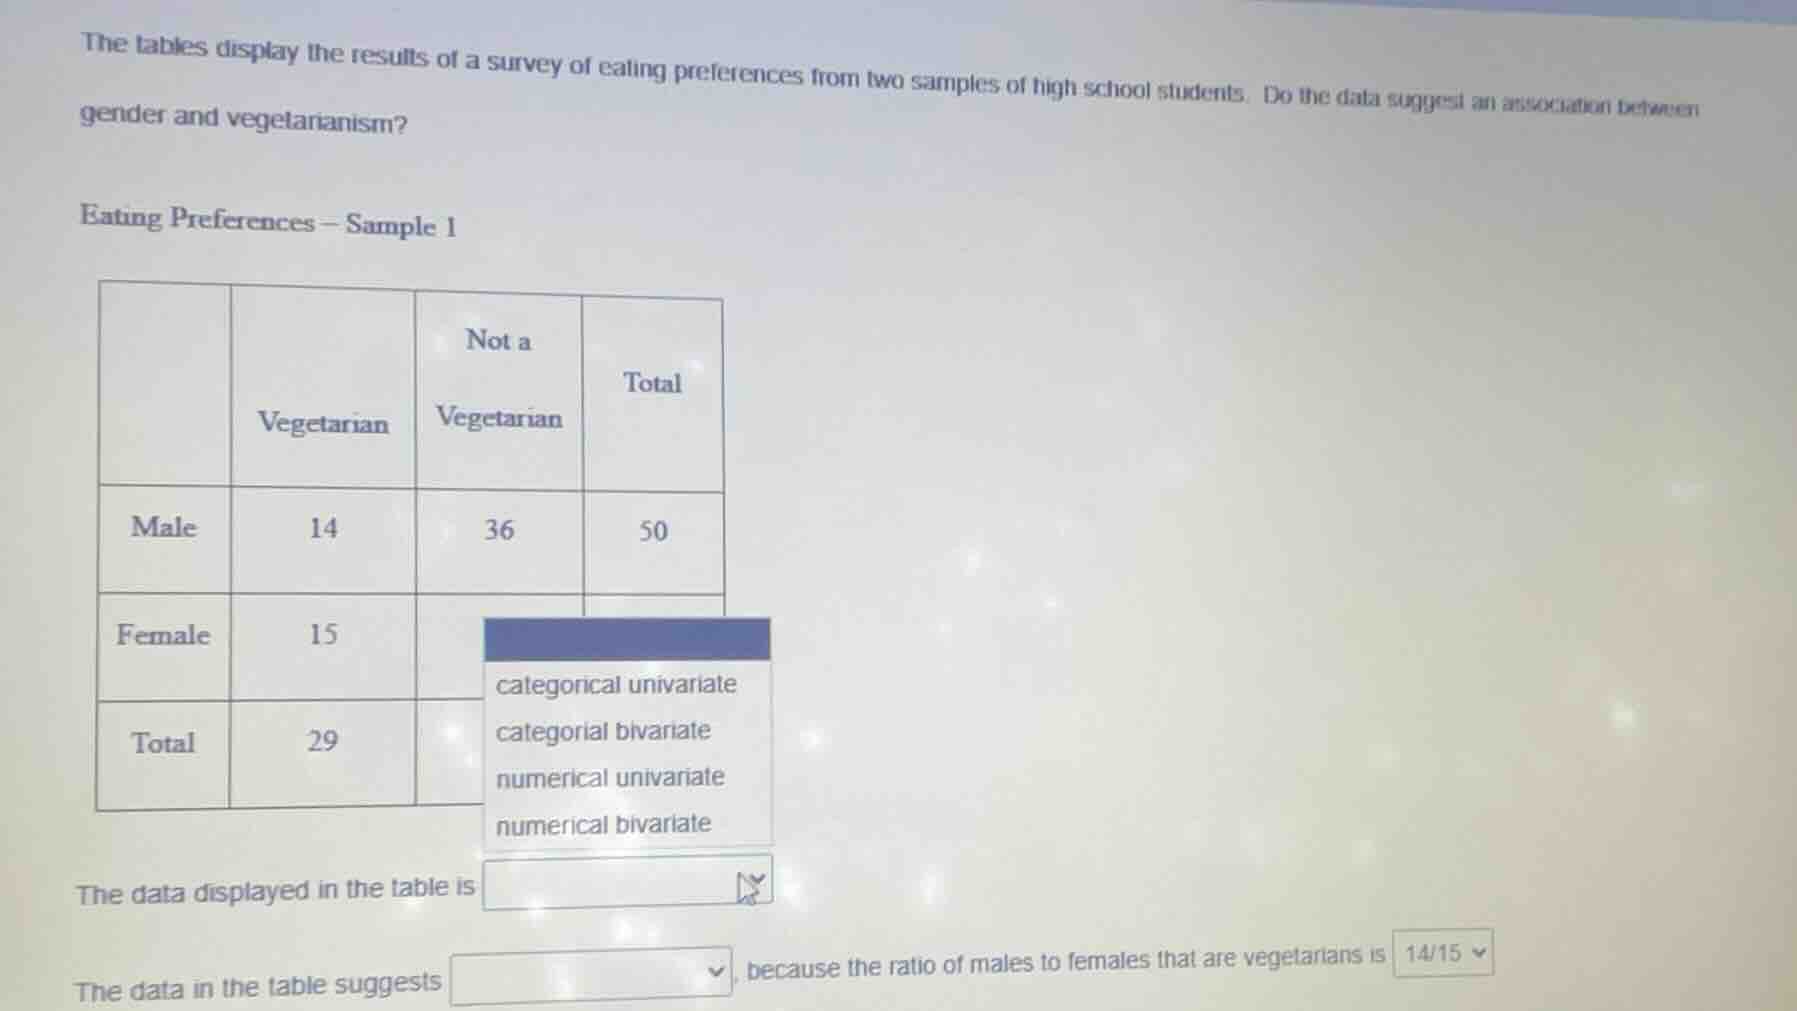
the tables display the results of a survey of eating preferences from two samples of high school students. do the data suggest an association between gender and vegetarianism?
eating preferences - sample 1
| vegetarian | not a vegetarian | total | |
| male | 14 | 36 | 50 |
| female | 15 | ||
| total | 29 |
the data displayed in the table is dropdown with options: categorical univariate, categorial bivariate, numerical univariate, numerical bivariate
the data in the table suggests dropdown, because the ratio of males to females that are vegetarians is 14/15 dropdown
Part 1: Type of Data in the Table
The table shows two categorical variables: gender (male/female) and eating preference (vegetarian/not a vegetarian). Bivariate data involves two variables, and since both are categorical, the data is categorical bivariate. Univariate would involve only one variable, so that's not the case here.
We calculate the ratio of male vegetarians (14) to female vegetarians (15), which is \( \frac{14}{15}\approx0.93 \). A ratio close to 1 implies that the proportion of male vegetarians is similar to that of female vegetarians, so there is little to no association between gender and vegetarianism.

Snap & solve any problem in the app
Get step-by-step solutions on Sovi AI
Photo-based solutions with guided steps
Explore more problems and detailed explanations
categorical bivariate
Part 2: Association Between Gender and Vegetarianism
To determine association, we compare the proportions (or ratios) of vegetarians by gender. The number of male vegetarians is 14, female vegetarians is 15. The ratio of male to female vegetarians is \( \frac{14}{15} \approx 0.93 \), which is close to 1. If the ratio was far from 1, there would be a stronger association, but since it's close to 1, the data suggests little to no association (or "no strong association"). (Note: The exact phrasing may depend on context, but with a ratio near 1, the association is weak or non - existent.)