QUESTION IMAGE
Question
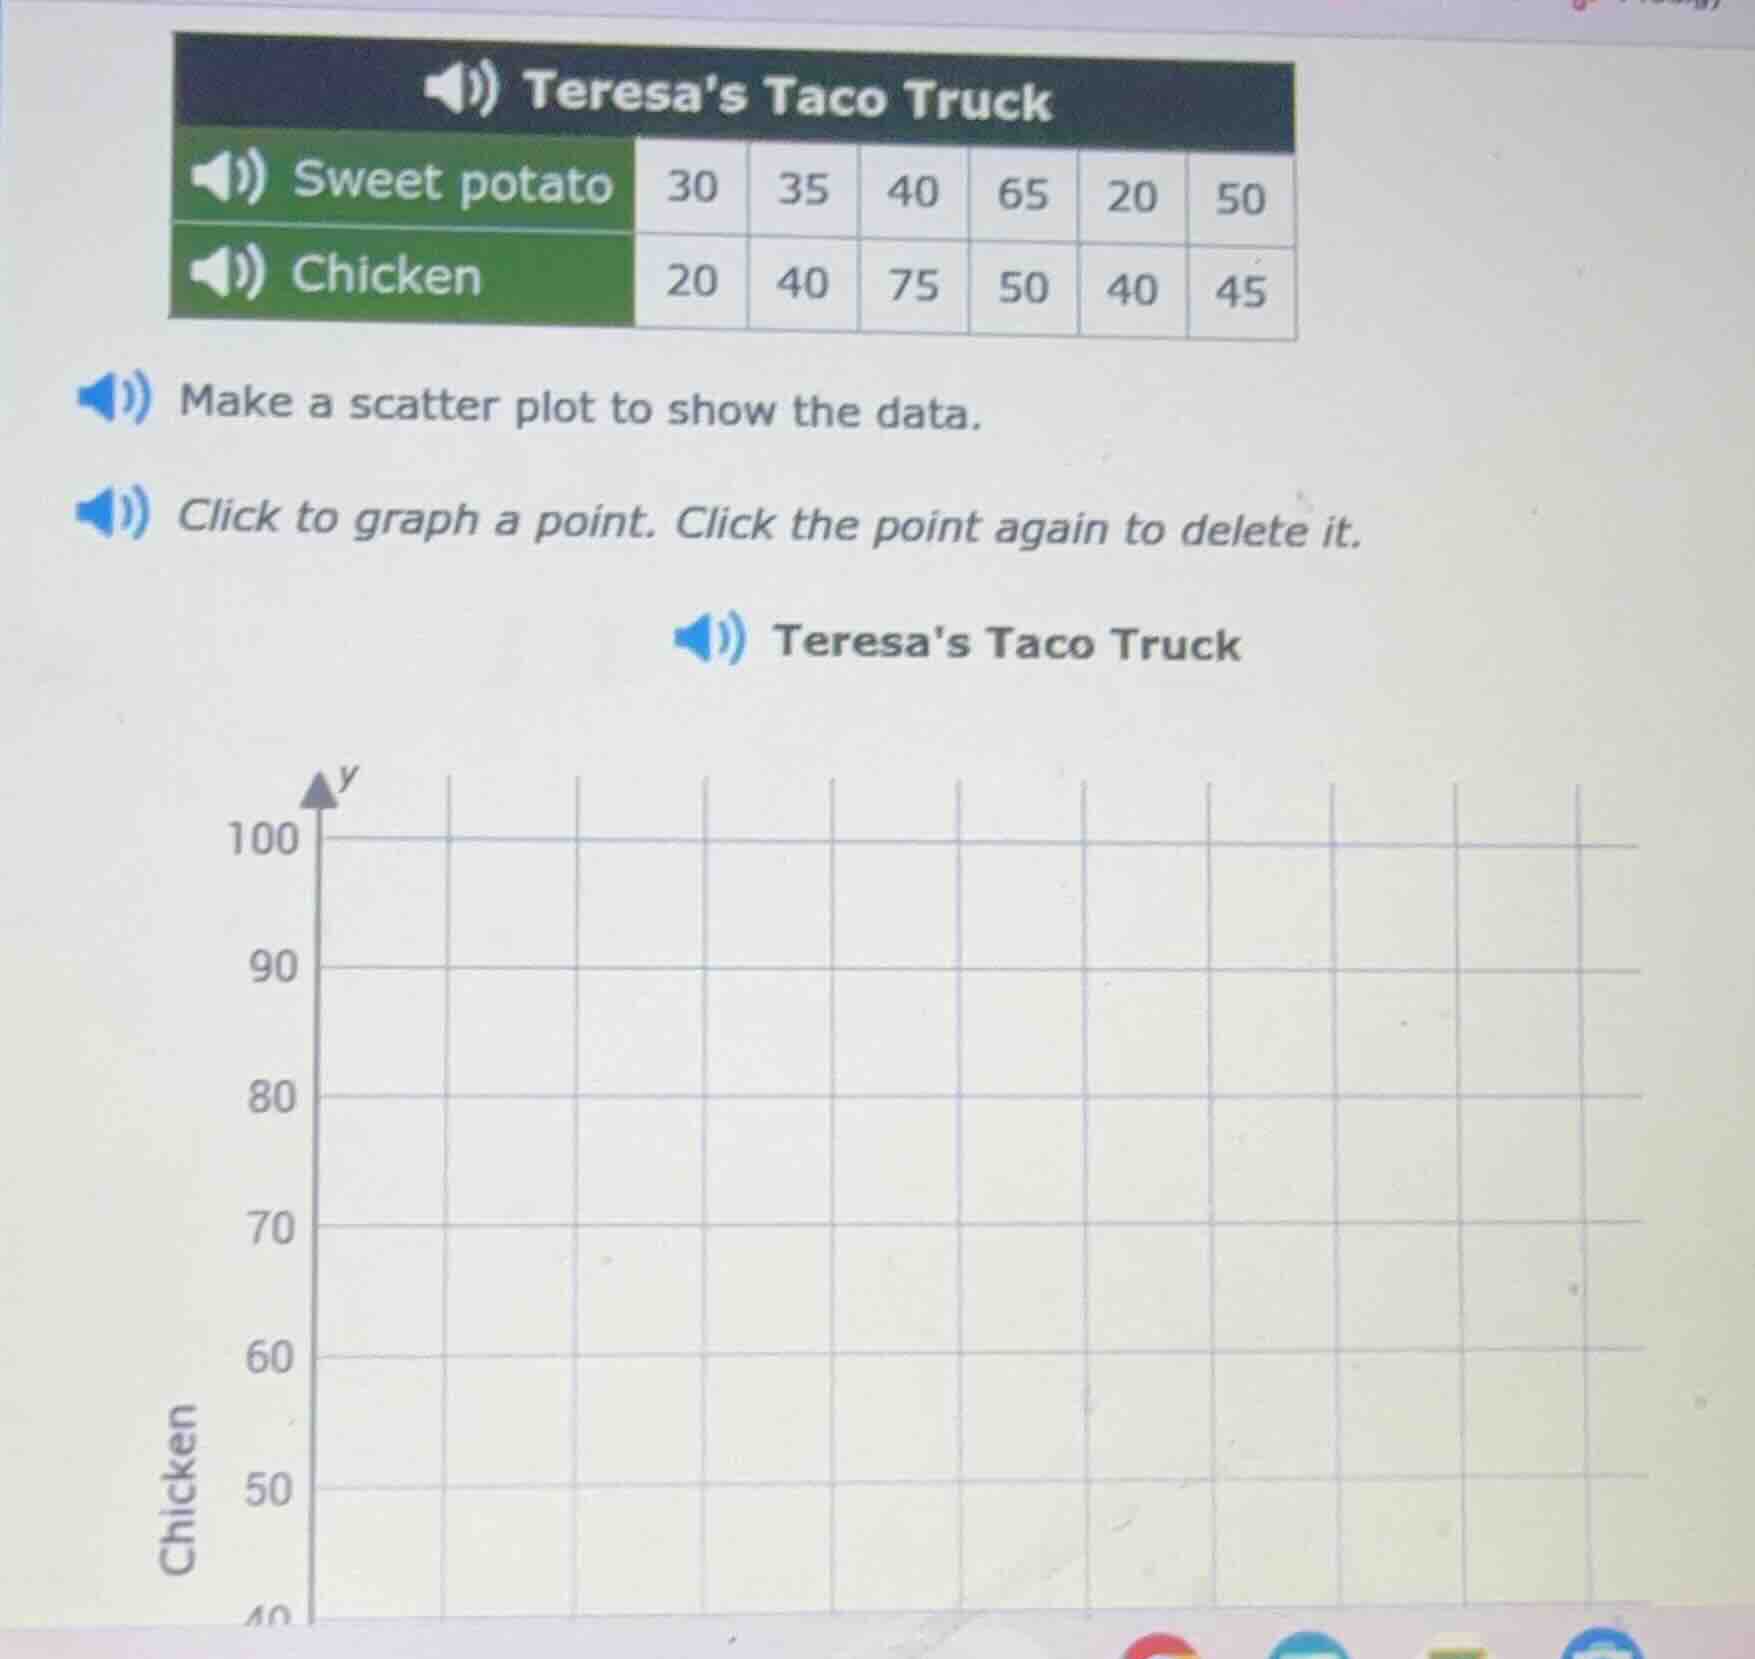
teresas taco truck
sweet potato: 30, 35, 40, 65, 20, 50
chicken: 20, 40, 75, 50, 40, 45
make a scatter plot to show the data.
click to graph a point. click the point again to delete it.
teresas taco truck
(graph with y - axis labeled chicken, scale from 40 to 100, x - axis related to sweet potato)
Step1: Identify x and y variables
Let \( x \)-axis represent "Sweet potato" values and \( y \)-axis represent "Chicken" values. The data pairs are: \((30, 20)\), \((35, 40)\), \((40, 75)\), \((65, 50)\), \((20, 40)\), \((50, 45)\).
Step2: Plot each point
- For \((30, 20)\): Find \( x = 30 \) on x - axis and \( y = 20 \) on y - axis (but y - axis starts at 40? Wait, maybe the y - axis is misread. Wait, the y - axis is labeled "Chicken" with 40, 50, 60,... So adjust: The first point: Sweet potato = 30, Chicken = 20? Wait no, looking at the table: Sweet potato row: 30, 35, 40, 65, 20, 50; Chicken row: 20, 40, 75, 50, 40, 45. So the pairs are (30,20), (35,40), (40,75), (65,50), (20,40), (50,45). Now, on the graph, x - axis is Sweet potato (values 20,30,35,40,50,65) and y - axis is Chicken (values 20,40,45,50,75). So plot each (x,y):
- (30,20): x = 30, y = 20 (but y - axis has 40 as the first marked? Wait, maybe the graph's y - axis is from 0 upwards. So:
- (30,20): Move to x = 30, y = 20.
- (35,40): x = 35, y = 40.
- (40,75): x = 40, y = 75.
- (65,50): x = 65, y = 50.
- (20,40): x = 20, y = 40.
- (50,45): x = 50, y = 45.

Snap & solve any problem in the app
Get step-by-step solutions on Sovi AI
Photo-based solutions with guided steps
Explore more problems and detailed explanations
The scatter plot should have points at \((20, 40)\), \((30, 20)\), \((35, 40)\), \((40, 75)\), \((50, 45)\), \((65, 50)\) plotted on the coordinate system with "Sweet potato" on the x - axis and "Chicken" on the y - axis.