QUESTION IMAGE
Question
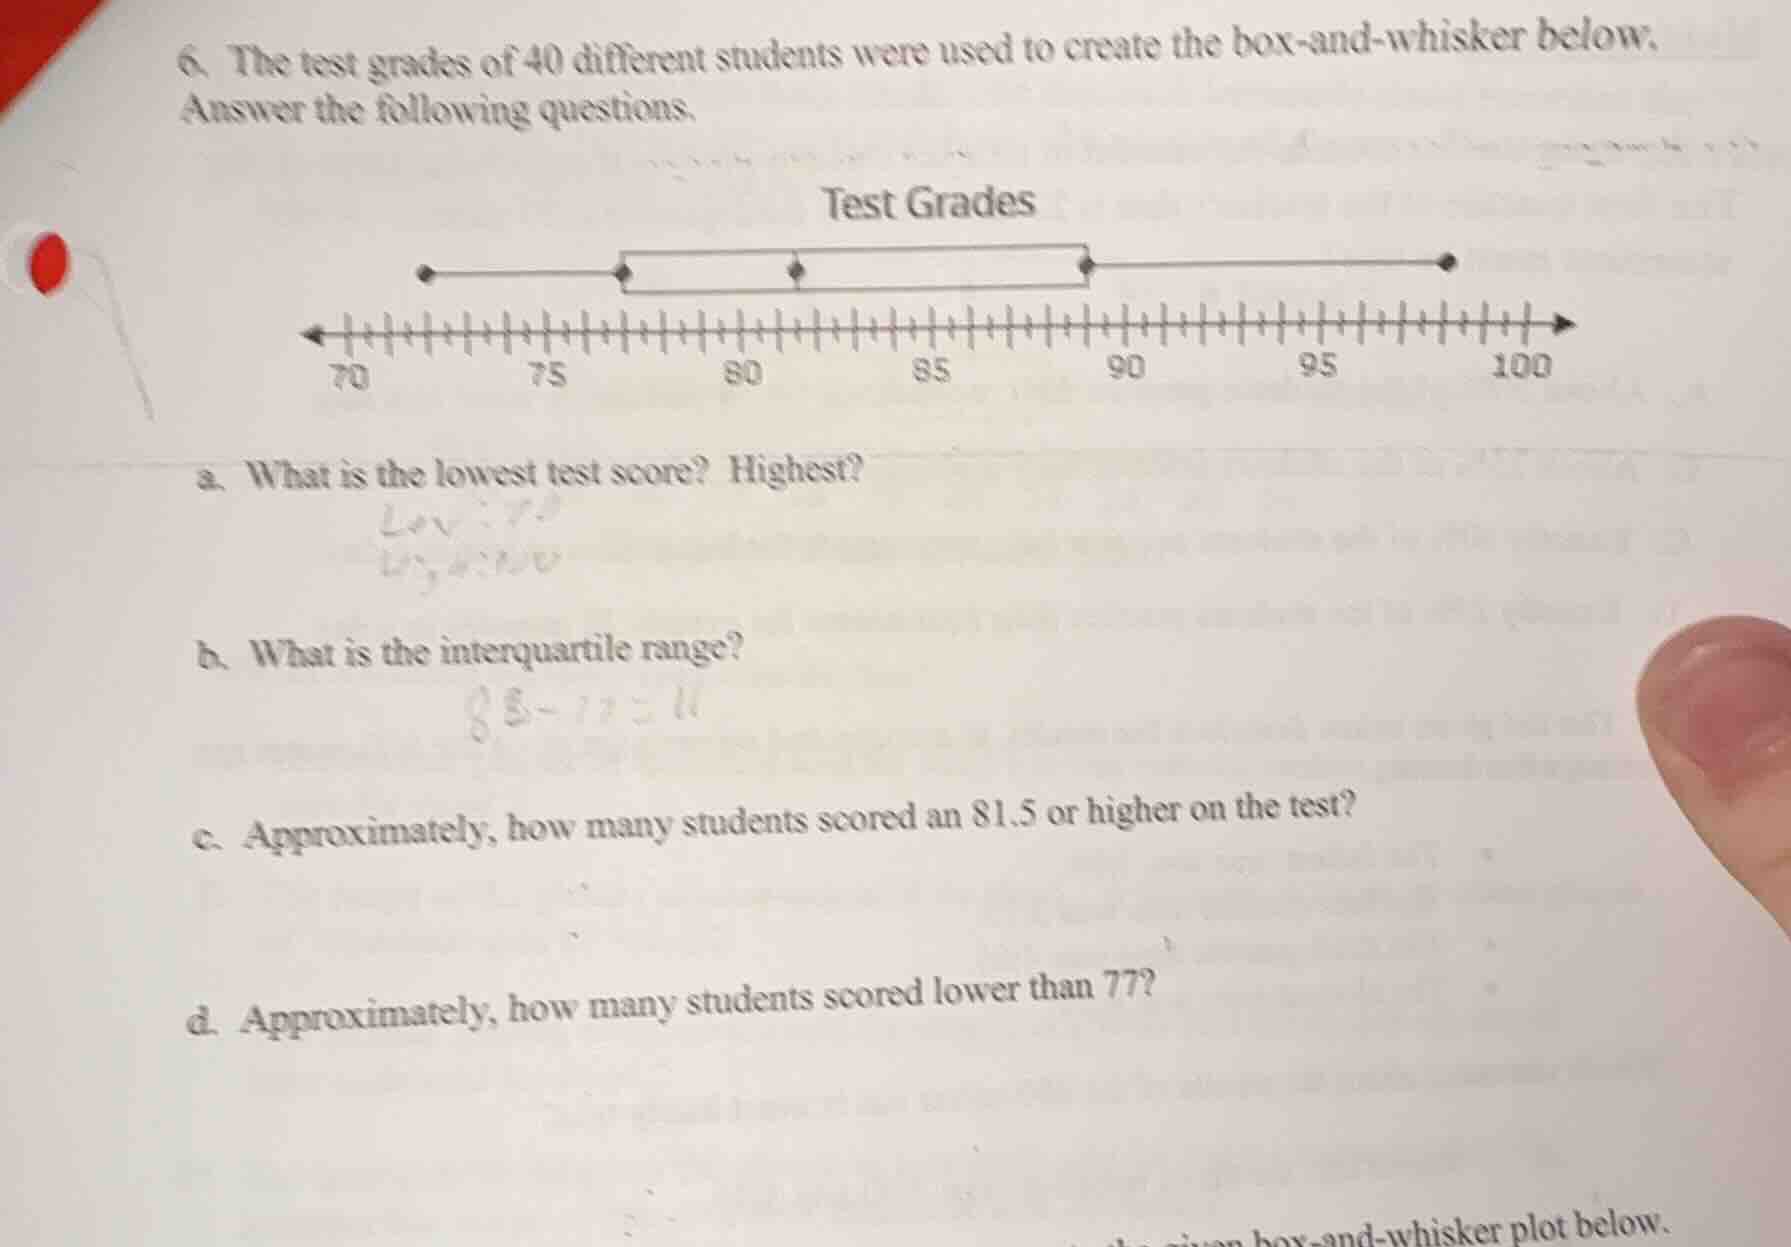
- the test grades of 40 different students were used to create the box-and-whisker below. answer the following questions.
test grades
a. what is the lowest test score? highest?
b. what is the interquartile range?
c. approximately, how many students scored an 81.5 or higher on the test?
d. approximately, how many students scored lower than 77?
Step1: Identify min/max from plot
Lowest score: left whisker end = 72; Highest score: right whisker end = 99
Step2: Calculate interquartile range
Interquartile range = Q3 - Q1 = $90 - 76 = 14$
Step3: Find students with score ≥81.5
81.5 is Q2 (median). 50% of 40 students: $\frac{50}{100} \times 40 = 20$
Step4: Find students with score <77
77 is between Q1 (76) and min (72). This is 25% of data: $\frac{25}{100} \times 40 = 10$

Snap & solve any problem in the app
Get step-by-step solutions on Sovi AI
Photo-based solutions with guided steps
Explore more problems and detailed explanations
a. Lowest test score: 72; Highest test score: 99
b. 14
c. 20
d. 10