QUESTION IMAGE
Question
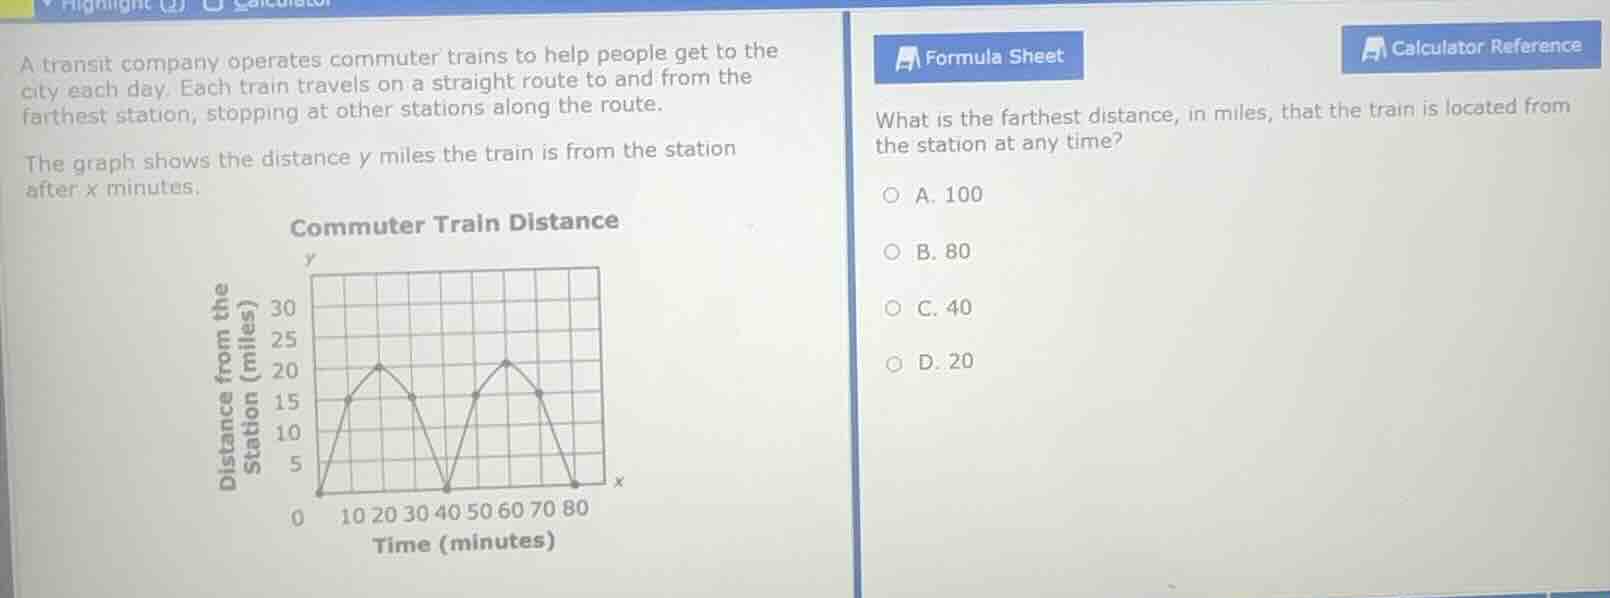
a transit company operates commuter trains to help people get to the city each day. each train travels on a straight route to and from the farthest station, stopping at other stations along the route.
the graph shows the distance y miles the train is from the station after x minutes.
commuter train distance
graph: x - axis time (minutes) from 0 to 80, y - axis distance from the station (miles) from 0 to 30. the graph shows a wave - like pattern with peaks and troughs.
what is the farthest distance, in miles, that the train is located from the station at any time?
a. 100
b. 80
c. 40
d. 20
To find the farthest distance the train is from the station, we look at the maximum value of the \( y \)-axis (distance from station) in the graph. The graph's \( y \)-values (distance) peak at 20 miles? Wait, no, wait. Wait, the graph's \( y \)-axis is labeled "Distance from the Station (miles)" with markings at 5, 10, 15, 20, 25, 30. Looking at the peaks of the graph (the highest points), we can see that the maximum \( y \)-value (distance) reached is 20? Wait, no, wait the options are 100, 80, 40, 20. Wait, maybe I misread the graph. Wait, the x-axis is time in minutes (0 to 80), and the y-axis is distance. Wait, the peaks of the graph (the highest points) are at \( y = 20 \)? Wait, no, looking at the graph, the first peak is at around \( x = 20 \) minutes with \( y = 20 \) miles? Wait, no, the grid lines: each grid square for y: from 0 to 30, with 5-unit increments. The peaks (the highest points of the graph) are at \( y = 20 \)? Wait, but the options include 20 (D), 40 (C), 80 (B), 100 (A). Wait, maybe I misinterpret the graph. Wait, the question is "the farthest distance, in miles, that the train is located from the station at any time". So we need the maximum \( y \)-value (distance) from the graph. Looking at the graph, the highest point (peak) has a \( y \)-coordinate of 20? Wait, no, maybe the graph is scaled differently? Wait, no, the y-axis is labeled with 5, 10, 15, 20, 25, 30. The peaks (the top of the curves) are at \( y = 20 \). So the maximum distance is 20 miles? Wait, but the options include 20 (D). Wait, but let's check again. Wait, maybe the graph is not to scale, but the key is the maximum \( y \)-value. The graph's peaks reach up to \( y = 20 \), so the farthest distance is 20 miles. Wait, but maybe I made a mistake. Wait, the options are A.100, B.80, C.40, D.20. So the correct answer should be D? Wait, no, wait maybe the graph's y-axis is actually representing a different scale? Wait, no, the problem says "the graph shows the distance y miles the train is from the station after x minutes". So the y-axis is distance in miles. The peaks (highest points) of the graph are at \( y = 20 \), so the maximum distance is 20 miles. So the answer is D? Wait, no, wait maybe I misread the graph. Wait, the first peak is at \( x = 20 \) minutes, \( y = 20 \) miles. The second peak is at \( x = 60 \) minutes, \( y = 20 \) miles. So the maximum distance is 20 miles, so the answer is D.20? Wait, but let's confirm. The question is asking for the farthest distance, so we look for the maximum value of \( y \) (distance) in the graph. The graph's highest point (peak) is at \( y = 20 \), so the answer is D.20.

Snap & solve any problem in the app
Get step-by-step solutions on Sovi AI
Photo-based solutions with guided steps
Explore more problems and detailed explanations
D. 20