QUESTION IMAGE
Question
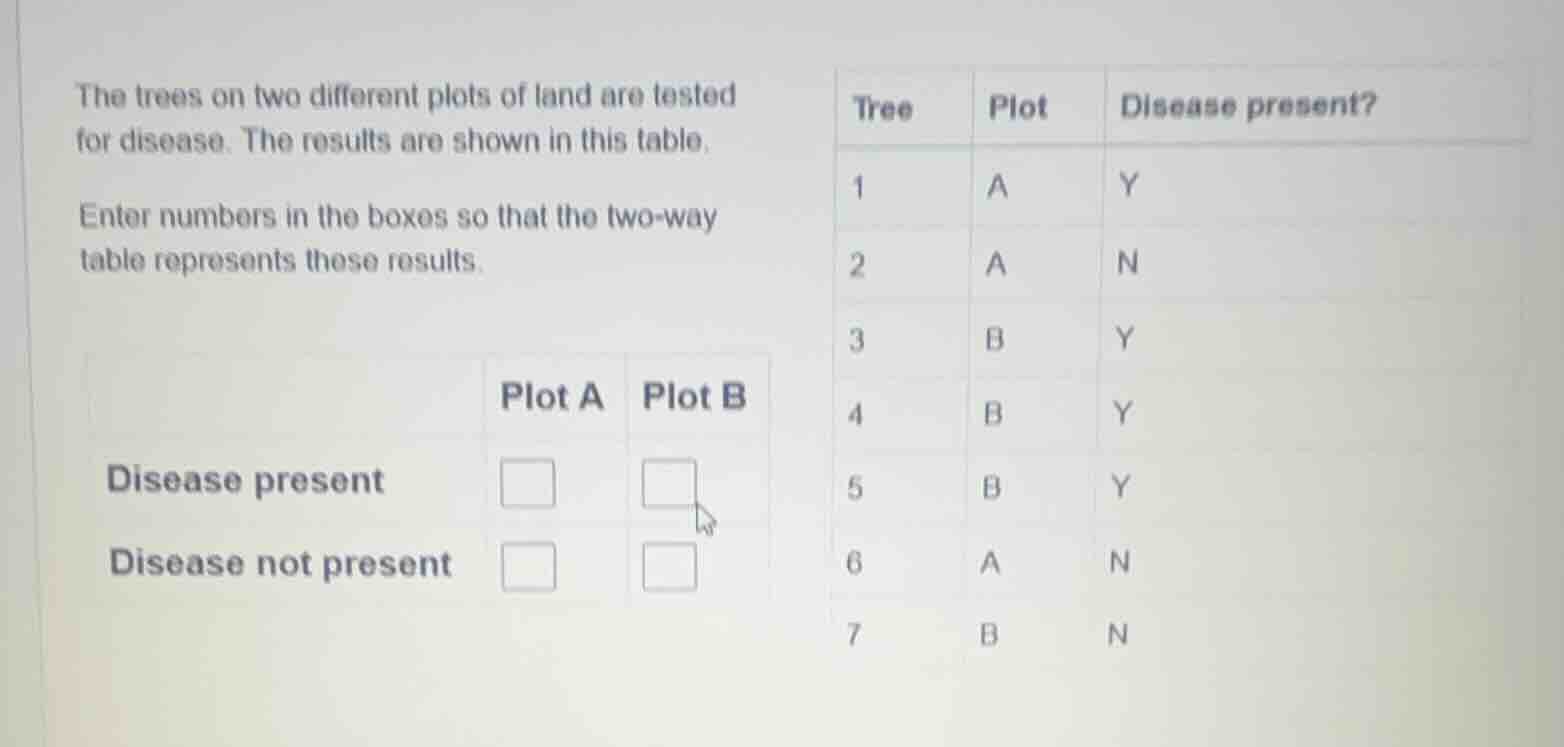
the trees on two different plots of land are tested for disease. the results are shown in this table. enter numbers in the boxes so that the two - way table represents these results.
| plot a | plot b | |
|---|---|---|
| disease not present | \square | \square |
| tree | plot | disease present? |
| 1 | a | y |
| 2 | a | n |
| 3 | b | y |
| 4 | b | y |
| 5 | b | y |
| 6 | a | n |
| 7 | b | n |
Step1: Count Disease present in Plot A
Check rows where Plot is A and Disease present is Y. Tree 1: Plot A, Y. So count = 1.
Step2: Count Disease present in Plot B
Check rows where Plot is B and Disease present is Y. Trees 3,4,5: Plot B, Y. So count = 3.
Step3: Count Disease not present in Plot A
Check rows where Plot is A and Disease present is N. Trees 2,6: Plot A, N. So count = 2.
Step4: Count Disease not present in Plot B
Check rows where Plot is B and Disease present is N. Tree 7: Plot B, N. So count = 1.

Snap & solve any problem in the app
Get step-by-step solutions on Sovi AI
Photo-based solutions with guided steps
Explore more problems and detailed explanations
For the two - way table:
| Plot A | Plot B | |
|---|---|---|
| Disease not present | 2 | 1 |
So the numbers to fill are (from top - left to bottom - right in the two - way table boxes): 1, 3, 2, 1.