QUESTION IMAGE
Question
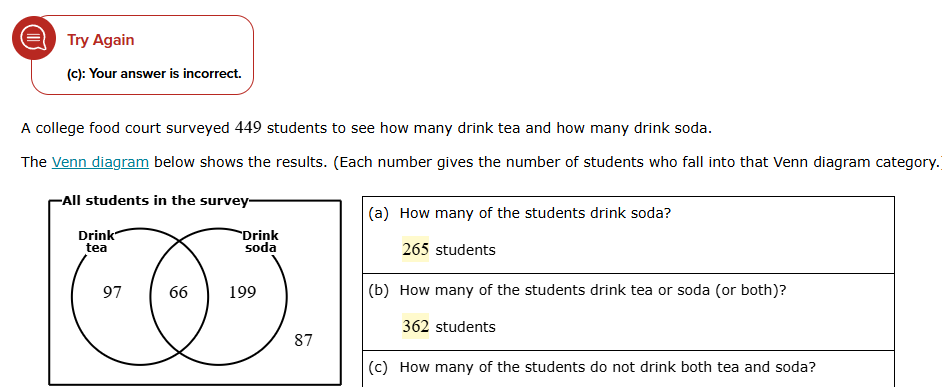
try again (c): your answer is incorrect. a college food court surveyed 449 students to see how many drink tea and how many drink soda. the venn diagram below shows the results. (each number gives the number of students who fall into that venn diagram category. all students in the survey drink tea drink soda 97 66 199 87 (a) how many of the students drink soda? 265 students (b) how many of the students drink tea or soda (or both)? 362 students (c) how many of the students do not drink both tea and soda?
Step1: Understand the total and the both group
The total number of students surveyed is 449. The number of students who drink both tea and soda is 66 (from the overlapping part of the Venn diagram).
Step2: Calculate the number of students who do not drink both
To find the number of students who do not drink both, we subtract the number of students who drink both from the total number of students. So, we calculate \( 449 - 66 \).
\( 449 - 66 = 383 \)

Snap & solve any problem in the app
Get step-by-step solutions on Sovi AI
Photo-based solutions with guided steps
Explore more problems and detailed explanations
383