QUESTION IMAGE
Question
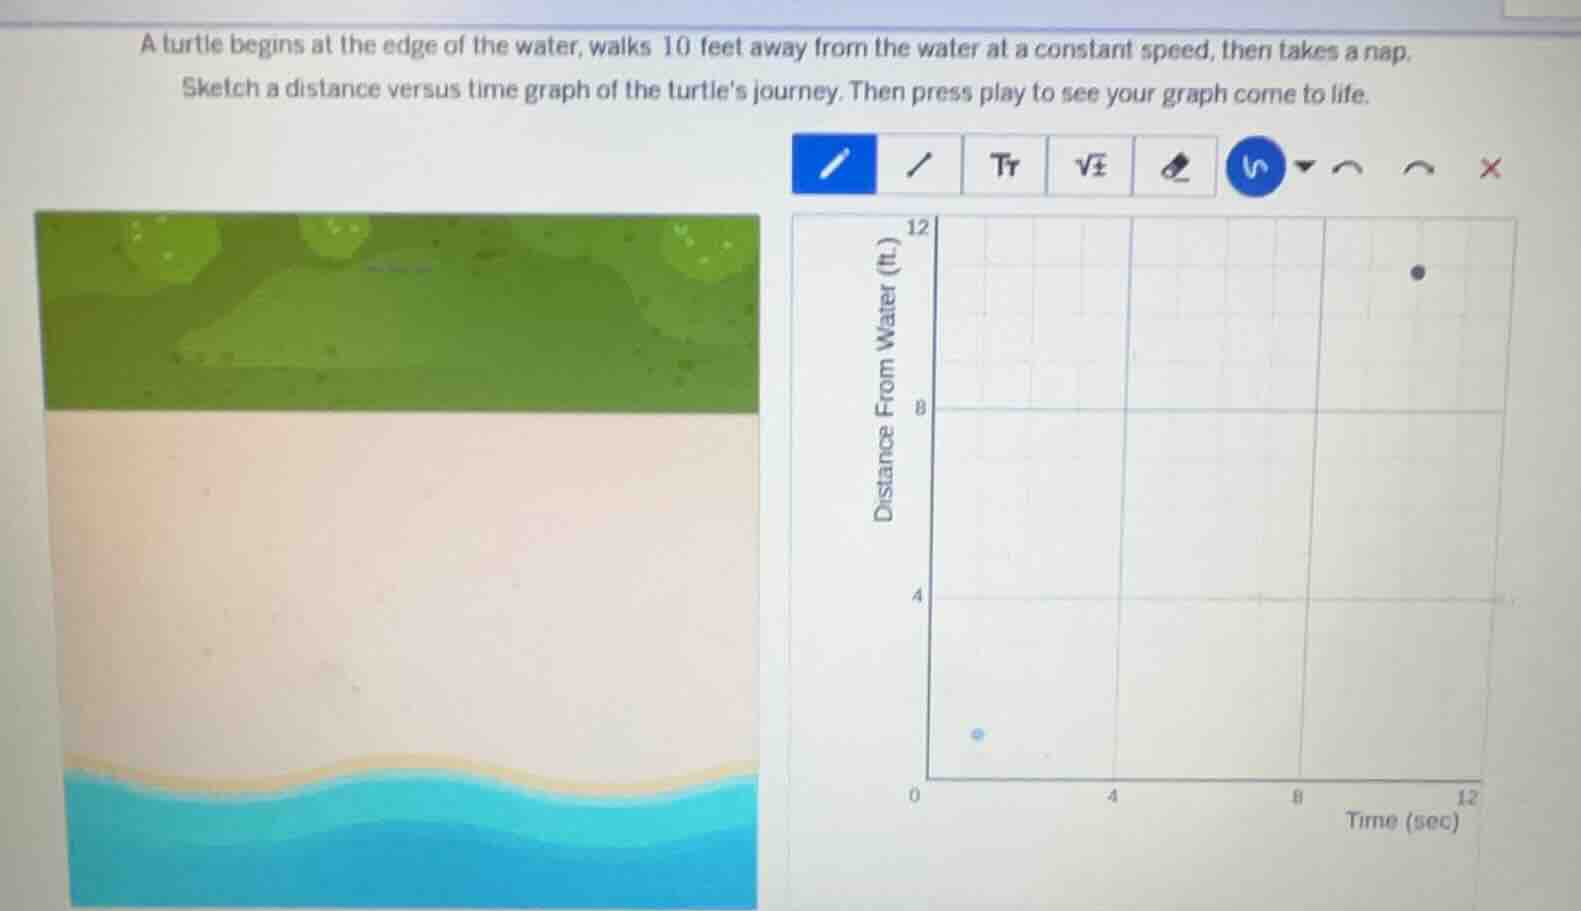
a turtle begins at the edge of the water, walks 10 feet away from the water at a constant speed, then takes a nap. sketch a distance versus time graph of the turtles journey. then press play to see your graph come to life.
Step1: Analyze the initial motion
The turtle starts at the edge of the water, so at time \( t = 0 \), the distance from the water \( d = 0 \). It walks 10 feet away from the water at a constant speed. So, during the walking phase, the distance from the water increases linearly with time. Let's assume the time taken to walk 10 feet is \( t_1 \). The graph during this time will be a straight line with a positive slope, starting from the origin \((0,0)\) and ending at \((t_1, 10)\).
Step2: Analyze the napping phase
After walking 10 feet, the turtle takes a nap. During the nap, the time increases, but the distance from the water remains constant at 10 feet. So, the graph during this phase will be a horizontal line starting from \((t_1, 10)\) and extending to the right as time increases.
Sketch Description (to help visualize the graph):
- Axes: The x - axis is time (in seconds) and the y - axis is distance from water (in feet).
- First Segment (Walking): Draw a straight line from the point \((0,0)\) to a point \((t_1, 10)\) where \( t_1 \) is the time it takes for the turtle to walk 10 feet. The slope of this line is equal to the speed of the turtle (\( \text{speed}=\frac{10}{t_1} \)).
- Second Segment (Napping): From the point \((t_1, 10)\), draw a horizontal line to the right (parallel to the x - axis) to represent the time when the turtle is napping and the distance from the water is constant at 10 feet.
If we were to plot this on the given grid (where the y - axis has marks at 0, 4, 8, 12 and x - axis at 0, 4, 8, 12):
- The first segment goes from (0,0) to, say, if the turtle takes 8 seconds to walk 10 feet (we can choose a reasonable \( t_1 \), for example), (8,10) (but the actual \( t_1 \) depends on the speed, but the key is the shape).
- The second segment goes from (8,10) (or whatever \( t_1 \) we choose) to the right, like (12,10) if we consider the x - axis up to 12 seconds.
(Note: Since the problem is about sketching, the main idea is the shape of the graph: a linear increase followed by a horizontal line at \( d = 10 \) feet.)

Snap & solve any problem in the app
Get step-by-step solutions on Sovi AI
Photo-based solutions with guided steps
Explore more problems and detailed explanations
The graph should consist of two parts: a linear segment from \((0,0)\) to \((t_1, 10)\) (representing the walking) and a horizontal segment from \((t_1, 10)\) onwards (representing the napping), where \( t_1 \) is the time taken to walk 10 feet.