QUESTION IMAGE
Question
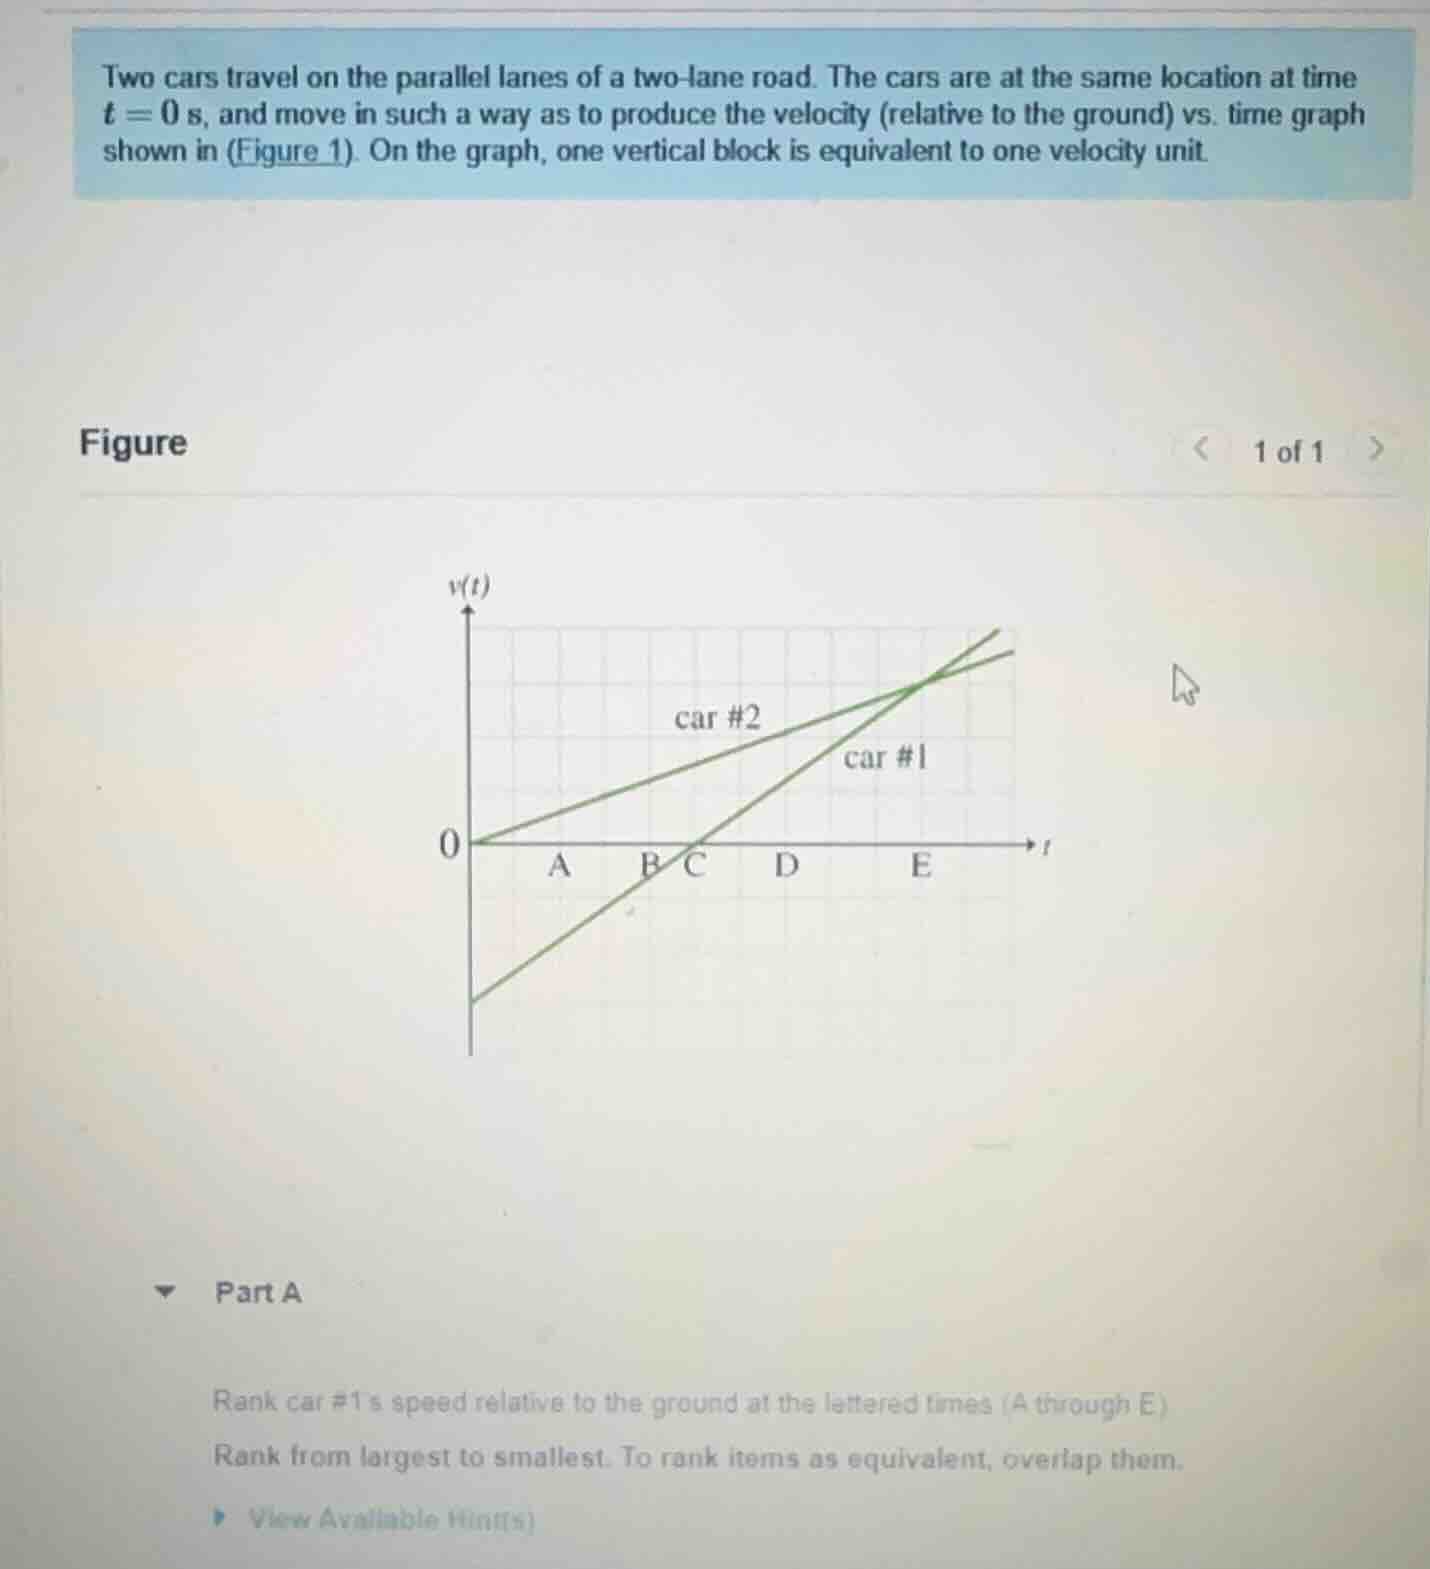
two cars travel on the parallel lanes of a two - lane road. the cars are at the same location at time $t = 0$ s, and move in such a way as to produce the velocity (relative to the ground) vs. time graph shown in (figure 1). on the graph, one vertical block is equivalent to one velocity unit.
part a
rank car #1s speed relative to the ground at the lettered times (a through e)
rank from largest to smallest. to rank items as equivalent, overlap them.
view available hint(s)
Step1: Understand velocity - time graph
In a velocity - time graph, the speed (magnitude of velocity) of an object at a particular time \(t\) is given by the vertical (y - axis) value of the velocity - time curve at that time \(t\). For a linear velocity - time graph (like the graph of car #1), the velocity \(v(t)\) is a linear function of time, \(v(t)=v_0 + at\), where \(v_0\) is the initial velocity and \(a\) is the acceleration. As time \(t\) increases, if the acceleration \(a\) is positive (which it is for car #1 as the graph is a straight line with a positive slope starting from a negative initial velocity and moving towards positive), the magnitude of velocity (speed) will increase as time increases (after the velocity becomes positive).
Step2: Analyze the speed at different times
- At time \(A\): The velocity of car #1 is negative (since it is below the \(t\) - axis) and has a certain magnitude.
- At time \(B\): The velocity of car #1 is still negative but closer to zero (since the graph is moving upwards towards the \(t\) - axis), so its magnitude (speed) is greater than at time \(A\) but less than when velocity is positive.
- At time \(C\): The velocity of car #1 is zero (it crosses the \(t\) - axis at \(C\)), so speed is zero? No, wait, speed is the magnitude of velocity. At \(C\), velocity \(v = 0\), so speed is \(0\)? Wait, no, let's re - examine. Wait, the graph of car #1 starts below the \(t\) - axis (negative initial velocity) and has a positive slope. So as time increases from \(0\) to \(C\), the velocity is increasing (becoming less negative, then zero at \(C\), then positive after \(C\)).
- At time \(D\): After \(C\), the velocity is positive. The value of velocity (and hence speed) at \(D\) is positive and greater than at \(C\) (where speed was \(0\)).
- At time \(E\): The velocity of car #1 at \(E\) is positive and greater than at \(D\) because the graph is a straight line with a positive slope, so as \(t\) increases (from \(D\) to \(E\)), the velocity (and hence speed) increases.
Wait, actually, let's correct the earlier mis - analysis. The speed is the magnitude of velocity. So:
- At \(A\): \(v_A\) is negative, speed \(s_A=\vert v_A\vert\)
- At \(B\): \(v_B\) is negative, \(s_B = \vert v_B\vert\), and since \(v_B>v_A\) (because the graph is moving up), \(\vert v_B\vert<\vert v_A\vert\) (wait, no: if \(v_A=-5\) and \(v_B = - 3\), then \(\vert v_A\vert = 5\), \(\vert v_B\vert=3\), so \(s_A>s_B\)). But after \(C\), when velocity is positive:
- At \(C\): \(v_C = 0\), so \(s_C=0\)
- At \(D\): \(v_D>0\), so \(s_D=\vert v_D\vert=v_D\)
- At \(E\): \(v_E>v_D\) (since the graph has a positive slope), so \(s_E=\vert v_E\vert = v_E>v_D\)
Wait, no, I think I made a mistake. Let's look at the order of times: \(A < B < C < D < E\). The graph of car #1 is a straight line with a positive slope. So the velocity function for car #1 is \(v(t)=-v_0+at\) (where \(v_0>0\) is the initial magnitude of negative velocity and \(a>0\) is acceleration). So:
- At \(t = A\): \(v(A)=-v_0 + aA\) (negative, since \(aA
- At \(t = B\): \(v(B)=-v_0 + aB\) (negative, \(aB
- At \(t = C\): \(v(C)=-v_0 + aC = 0\) (since it crosses the \(t\) - axis at \(C\)), so \(s(C) = 0\)
- At \(t = D\): \(v(D)=-v_0 + aD>0\) (since \(D > C\)), so \(s(D)=v(D)\)
- At \(t = E\): \(v(E)=-v_0 + aE>v(D)\) (since \(E > D\) and \(a>0\)), so \(s(E)=v(E)>s(D)\)
- At \(t = B\): \(v(B)=-v_0 + aB\) (negative, \(aB
Now, comparing the speeds:
- \(s_E\): Positive and largest (since \(E\) is the latest time among…

Snap & solve any problem in the app
Get step-by-step solutions on Sovi AI
Photo-based solutions with guided steps
Explore more problems and detailed explanations
Step1: Understand velocity - time graph
In a velocity - time graph, the speed (magnitude of velocity) of an object at a particular time \(t\) is given by the vertical (y - axis) value of the velocity - time curve at that time \(t\). For a linear velocity - time graph (like the graph of car #1), the velocity \(v(t)\) is a linear function of time, \(v(t)=v_0 + at\), where \(v_0\) is the initial velocity and \(a\) is the acceleration. As time \(t\) increases, if the acceleration \(a\) is positive (which it is for car #1 as the graph is a straight line with a positive slope starting from a negative initial velocity and moving towards positive), the magnitude of velocity (speed) will increase as time increases (after the velocity becomes positive).
Step2: Analyze the speed at different times
- At time \(A\): The velocity of car #1 is negative (since it is below the \(t\) - axis) and has a certain magnitude.
- At time \(B\): The velocity of car #1 is still negative but closer to zero (since the graph is moving upwards towards the \(t\) - axis), so its magnitude (speed) is greater than at time \(A\) but less than when velocity is positive.
- At time \(C\): The velocity of car #1 is zero (it crosses the \(t\) - axis at \(C\)), so speed is zero? No, wait, speed is the magnitude of velocity. At \(C\), velocity \(v = 0\), so speed is \(0\)? Wait, no, let's re - examine. Wait, the graph of car #1 starts below the \(t\) - axis (negative initial velocity) and has a positive slope. So as time increases from \(0\) to \(C\), the velocity is increasing (becoming less negative, then zero at \(C\), then positive after \(C\)).
- At time \(D\): After \(C\), the velocity is positive. The value of velocity (and hence speed) at \(D\) is positive and greater than at \(C\) (where speed was \(0\)).
- At time \(E\): The velocity of car #1 at \(E\) is positive and greater than at \(D\) because the graph is a straight line with a positive slope, so as \(t\) increases (from \(D\) to \(E\)), the velocity (and hence speed) increases.
Wait, actually, let's correct the earlier mis - analysis. The speed is the magnitude of velocity. So:
- At \(A\): \(v_A\) is negative, speed \(s_A=\vert v_A\vert\)
- At \(B\): \(v_B\) is negative, \(s_B = \vert v_B\vert\), and since \(v_B>v_A\) (because the graph is moving up), \(\vert v_B\vert<\vert v_A\vert\) (wait, no: if \(v_A=-5\) and \(v_B = - 3\), then \(\vert v_A\vert = 5\), \(\vert v_B\vert=3\), so \(s_A>s_B\)). But after \(C\), when velocity is positive:
- At \(C\): \(v_C = 0\), so \(s_C=0\)
- At \(D\): \(v_D>0\), so \(s_D=\vert v_D\vert=v_D\)
- At \(E\): \(v_E>v_D\) (since the graph has a positive slope), so \(s_E=\vert v_E\vert = v_E>v_D\)
Wait, no, I think I made a mistake. Let's look at the order of times: \(A < B < C < D < E\). The graph of car #1 is a straight line with a positive slope. So the velocity function for car #1 is \(v(t)=-v_0+at\) (where \(v_0>0\) is the initial magnitude of negative velocity and \(a>0\) is acceleration). So:
- At \(t = A\): \(v(A)=-v_0 + aA\) (negative, since \(aA
- At \(t = B\): \(v(B)=-v_0 + aB\) (negative, \(aB
- At \(t = C\): \(v(C)=-v_0 + aC = 0\) (since it crosses the \(t\) - axis at \(C\)), so \(s(C) = 0\)
- At \(t = D\): \(v(D)=-v_0 + aD>0\) (since \(D > C\)), so \(s(D)=v(D)\)
- At \(t = E\): \(v(E)=-v_0 + aE>v(D)\) (since \(E > D\) and \(a>0\)), so \(s(E)=v(E)>s(D)\)
- At \(t = B\): \(v(B)=-v_0 + aB\) (negative, \(aB
Now, comparing the speeds:
- \(s_E\): Positive and largest (since \(E\) is the latest time among \(D\) and \(E\), and velocity is increasing after \(C\))
- \(s_D\): Positive and less than \(s_E\)
- \(s_C\): Zero
- \(s_B\): Magnitude of negative velocity, less than \(s_A\) (since \(v_B\) is closer to zero than \(v_A\))
- \(s_A\): Magnitude of negative velocity, larger than \(s_B\)
Wait, but this seems contradictory. Wait, maybe I misread the graph. Wait, the problem says "one vertical block is equivalent to one velocity unit". Let's assume that the x - axis is time, and the y - axis is velocity. Car #1 has a velocity - time graph that starts below the t - axis (negative velocity) and has a positive slope. So as time increases:
- At \(A\): velocity is negative, speed is \(\vert v_A\vert\)
- At \(B\): velocity is negative, speed is \(\vert v_B\vert\), \(\vert v_B\vert<\vert v_A\vert\) (since \(v_B>v_A\) (less negative))
- At \(C\): velocity is \(0\), speed is \(0\)
- At \(D\): velocity is positive, speed is \(v_D\)
- At \(E\): velocity is positive, speed is \(v_E\), and \(v_E>v_D\) (since the slope is positive, so for \(t_E>t_D\), \(v_E = v_D+a(t_E - t_D)>v_D\))
But we need to rank speed from largest to smallest. So the order of speed (magnitude of velocity) is:
\(E > D > B > A > C\)? Wait, no, wait at \(B\), the velocity is negative, at \(D\) it's positive. Let's take an example. Suppose the initial velocity of car #1 is \(v_0=- 4\) units (at \(t = 0\)) and acceleration \(a = 2\) units per second.
- At \(t = A\) (say \(t = 1\) s): \(v_A=-4 + 2\times1=-2\), speed \(s_A = 2\)
- At \(t = B\) (say \(t = 2\) s): \(v_B=-4 + 2\times2 = 0\)? No, that can't be. Wait, maybe the crossing point \(C\) is at some time. Let's assume that the graph of car #1 crosses the \(t\) - axis at \(C\). So before \(C\), velocity is negative, after \(C\), velocity is positive.
Let's assume the time intervals between \(A\), \(B\), \(C\), \(D\), \(E\) are equal. Let the acceleration of car #1 be \(a\) and initial velocity \(v_{01}<0\).
Then \(v(t)=v_{01}+a\times t\)
Speed \(s(t)=\vert v(t)\vert=
\), where \(t_C\) is the time when \(v(t_C)=0\) (i.e., \(t_C=-\frac{v_{01}}{a}\))
For \(t < t_C\) (times \(A\), \(B\)): as \(t\) increases, \(v(t)\) increases (becomes less negative), so \(s(t)=-v(t)\) decreases (since \(v(t)\) is increasing towards zero).
For \(t\geq t_C\) (times \(D\), \(E\)): as \(t\) increases, \(v(t)\) increases (since \(a>0\)), so \(s(t)=v(t)\) increases.
At \(t = C\), \(s(t)=0\)
So:
- For \(t = A\) and \(t = B\) ( \(A < B < t_C\)): \(s(A)>s(B)\) (because \(s(t)\) decreases as \(t\) increases towards \(t_C\) for \(t < t_C\))
- For \(t = D\) and \(t = E\) ( \(t_C < D < E\)): \(s(E)>s(D)\) (because \(s(t)\) increases as \(t\) increases for \(t\geq t_C\))
- Now, we need to compare \(s(B)\) (which is less than \(s(A)\)) with \(s(D)\) (which is positive). Since \(v(D)\) is positive and \(v(B)\) is negative, we need to see the magnitudes. Let's assume that the distance from the \(t\) - axis (magnitude) at \(D\) is greater than at \(B\). For example, if at \(B\), the velocity is \(-1\) (so speed \(1\)) and at \(D\), the velocity is \(2\) (so speed \(2\)), then \(s(D)>s(B)\)
So the order of speed from largest to smallest is: \(E > D > B > A > C\)? Wait, no, maybe I got \(B\) and \(D\) wrong. Wait, actually, when the velocity is negative (before \(C\)), the speed is the magnitude of the negative velocity, and when velocity is positive (after \(C\)), the speed is the positive velocity. If the slope of the velocity - time graph is such that the rate of increase of velocity (acceleration) is such that after \(C\), the velocity becomes positive and its magnitude (speed) at \(D\) is greater than the magnitude of the negative velocity at \(B\).
Looking at the graph, car #1's graph has a steeper slope than car #2? Wait, no, car #1 has a steeper slope (since it goes from below the axis to above, and car #2 has a shallower slope starting from zero). So the acceleration of car #1 is greater than that of car #2.
So, as time increases:
- At \(A\): speed (magnitude of negative velocity)
- At \(B\): speed (magnitude of negative velocity, less than at \(A\) because velocity is closer to zero)
- At \(C\): speed \(0\)
- At \(D\): speed (positive velocity, greater than the speed at \(B\) because the positive velocity at \(D\) has a greater magnitude than the negative velocity at \(B\))
- At \(E\): speed (positive velocity, greater than at \(D\) because velocity is increasing)
So the correct ranking of speed (from largest to smallest) is \(E > D > B > A > C\)? Wait, no, maybe I made a mistake in the comparison between \(B\) and \(D\). Let's think again. The key point is that in a velocity - time graph, the speed is the vertical distance from the \(t\) - axis. So for car #1:
- At \(E\): the vertical distance (speed) is the largest (since it's the farthest above the \(t\) - axis among the positive - velocity points)
- At \(D\): the vertical distance (speed) is less than at \(E\) but more than at \(B\) (because at \(B\), the vertical distance is below the \(t\) - axis, and at \(D\), it's above, and the distance above at \(D\) is more than the distance below at \(B\))
- At \(B\): the vertical distance (speed) is below the \(t\) - axis, less than at \(A\) (since it's closer to the \(t\) - axis than \(A\))
- At \(A\): the vertical distance (speed) is below the \(t\) - axis, more than at \(B\)
- At \(C\): the vertical distance (speed) is zero (on the \(t\) - axis)
So the order from largest to smallest speed is \(E\), \(D\), \(B\), \(A\), \(C\)? Wait, no, maybe the correct order is \(E > D > B > A > C\) is wrong. Wait, let's look at the graph again. The problem says "rank car #1's speed relative to the ground at the lettered times (A through E)".
Wait, maybe the initial velocity of car #1 is negative, and as time increases, the velocity increases (becomes less negative, then zero, then positive). So the speed (magnitude) at \(A\): let's say the velocity is \(-3\) (speed \(3\)), at \(B\): velocity is \(-1\) (speed \(1\)), at \(C\): velocity \(0\) (speed \(0\)), at \(D\): velocity \(2\) (speed \(2\)), at \(E\): velocity \(4\) (speed \(4\)). Then the order would be \(E(4)>D(2)>A(3)>B(1)>C(0)\)? No, that can't be, because \(3>2\). Oh! Here's the mistake. I assumed that the positive velocity at \(D\) is greater than the negative velocity magnitude at \(A\), but that's not necessarily true.
Let's take a correct example. Let the initial velocity of car #1 be \(v_0=-5\) m/s and acceleration \(a = 1\) m/s².
- At \(t = A\) (let \(A = 2\) s): \(v_A=-5 + 1\times2=-3\) m/s, speed \(s_A = 3\) m/s
- At \(t = B\) (let \(B = 4\) s): \(v_B=-5+1\times4 = - 1\) m/s, speed \(s_B = 1\) m/s
- At \(t = C\) (let \(C = 5\) s): \(v_C=-5 + 1\times5=0\) m/s, speed \(s_C = 0\) m/s
- At \(t = D\) (let \(D = 6\) s): \(v_D=-5+1\times6 = 1\) m/s, speed \(s_D = 1\) m/s
- At \(t = E\) (let \(E = 8\) s): \(v_E=-5 + 1\times8=3\) m/s, speed \(s_E = 3\) m/s
Wait, now in this case, \(s_A = s_E = 3\), \(s_D = s_B = 1\), \(s_C = 0\). But the graph of car #1 is a straight line, so the acceleration is constant. So the velocity function is linear, so the speed (magnitude of velocity) will have a minimum at \(C\) (where velocity is zero). Before \(C\), speed decreases as time increases (since velocity becomes less negative), and after \(C\), speed increases as time increases (since velocity becomes more positive).
So the speed at \(A\) and \(E\) can be equal (if the time from \(A\) to \(C\) is equal to the time from \(C\) to \(E\)), speed at \(B\) and \(D\) can be equal (if the time from \(B\) to \(C\) is equal to the time from \(C\) to \(D\)).
Looking at the graph, the distance from \(A\) to \(C\) and \(C\) to \(E\) seems to be equal (since the graph is symmetric around \(C\) in terms of the slope? Wait, no, the graph of car #1 has a constant slope, so the time it takes to go from \(A\) to \(C\) (where velocity goes from \(v_A\) to \(0\)) and from \(C\) to \(E\) (where velocity goes from \(0\) to \(v_E\)) will be such that if the slope is \(a\), then \(0 - v_A=a\times t_{AC}\) and \(v_E-0=a\times t_{CE}\). If \(t_{AC}=t_{CE}\) (which is likely from the graph's symmetry in terms of the grid), then \(v_E=\vert v_A\vert\), so speed at \(A\) and \(E\) are equal. Similarly, \(t_{BC}=t_{CD}\), so \(0 - v_B=a\times t_{BC}\) and \(v_D-0=a\times t_{CD}\), so \(v_D=\vert v_B\vert\), so speed at \(B\) and \(D\)