QUESTION IMAGE
Question
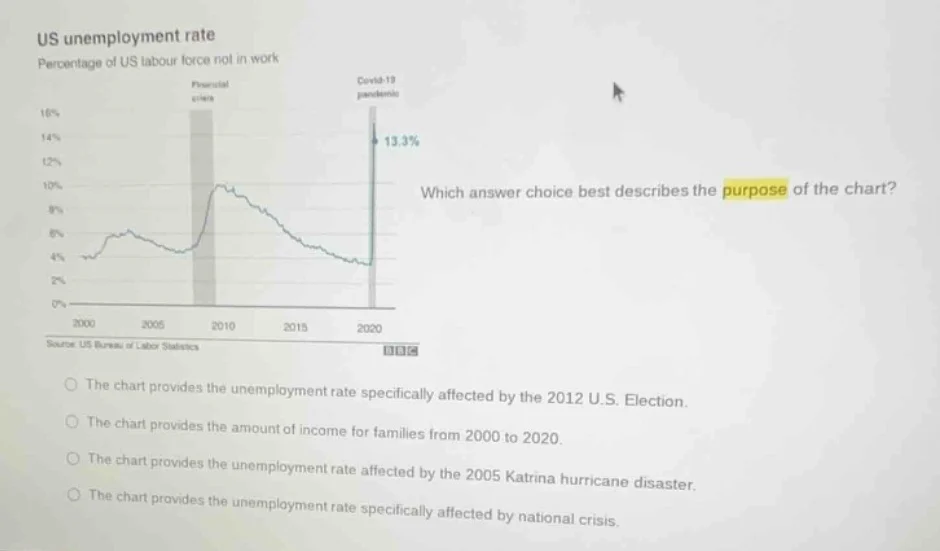
us unemployment rate
percentage of us labour force not in work
which answer choice best describes the purpose of the chart?
the chart provides the unemployment rate specifically affected by the 2012 u.s. election.
the chart provides the amount of income for families from 2000 to 2020.
the chart provides the unemployment rate affected by the 2005 katrina hurricane disaster.
the chart provides the unemployment rate specifically affected by national crisis.
The chart labels two major national crises (Financial crisis, Covid-19 pandemic) and shows corresponding spikes in the U.S. unemployment rate. The other options are incorrect: the 2012 election is not referenced, the chart does not track family income, and the 2005 Katrina disaster is not marked or linked to the data.

Snap & solve any problem in the app
Get step-by-step solutions on Sovi AI
Photo-based solutions with guided steps
Explore more problems and detailed explanations
The chart provides the unemployment rate specifically affected by national crisis.