QUESTION IMAGE
Question
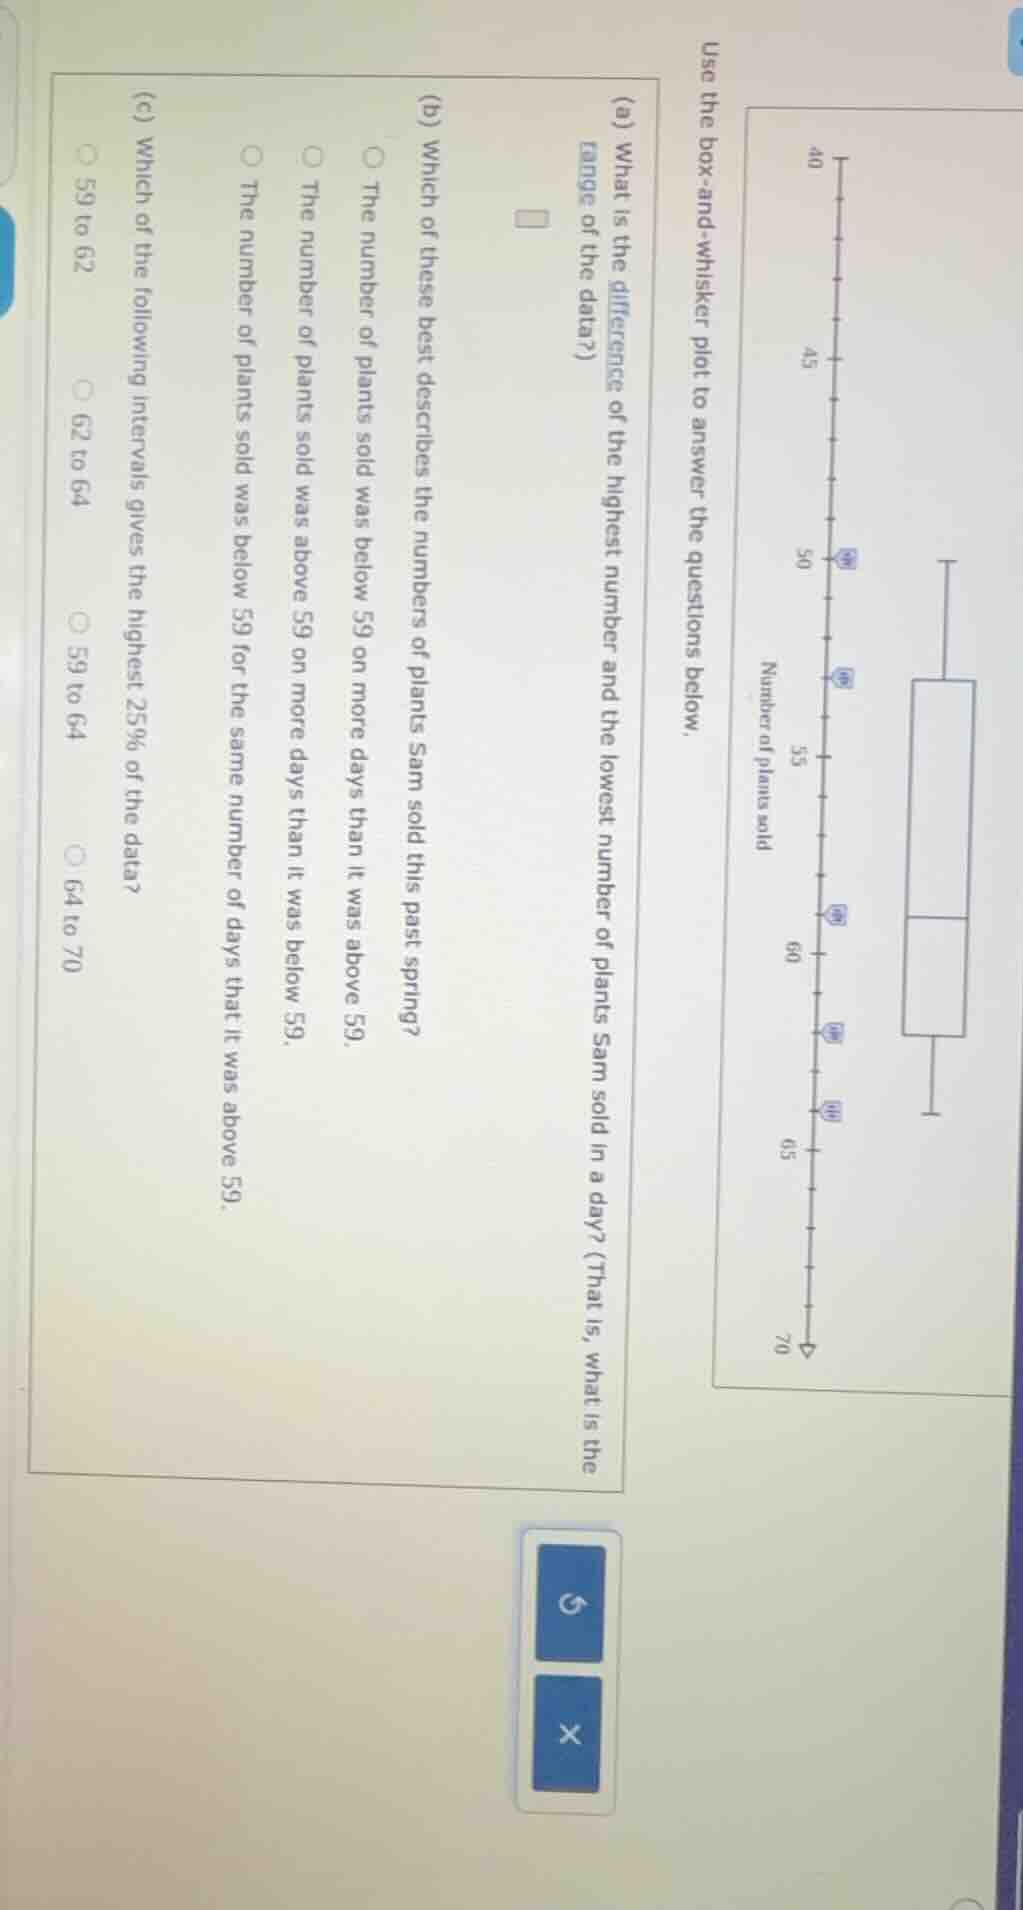
use the box - and - whisker plot to answer the questions below.
(a) what is the difference of the highest number and the lowest number of plants sam sold in a day? (that is, what is the range of the data?)
(b) which of these best describes the numbers of plants sam sold this past spring?
the number of plants sold was below 59 on more days than it was above 59.
the number of plants sold was above 59 on more days than it was below 59.
the number of plants sold was below 59 for the same number of days that it was above 59.
(c) which of the following intervals gives the highest 25% of the data?
59 to 62
62 to 64
59 to 64
64 to 70
Part (a)
Step1: Identify min and max
From box - whisker plot, min (lowest) is 50, max (highest) is 70.
Step2: Calculate range
Range = Max - Min = \(70 - 50 = 20\)
In a box - whisker plot, the median splits data into two equal parts. 59 is a value (likely a quartile or median - related). The number of days with plants sold below 59 and above 59 should be equal (since median or symmetric in terms of count for below/above a central value in a distribution). So "The number of plants sold was below 59 for the same number of days that it was above 59" is correct.
In a box - whisker plot, the upper quartile (Q3) represents the 75th percentile, so the range from Q3 to max represents the highest 25% of the data. From the plot, the upper quartile - max range is 64 to 70 (assuming the box and whisker plot's upper whisker and box indicate this). So the interval with the highest 25% is 64 to 70.

Snap & solve any problem in the app
Get step-by-step solutions on Sovi AI
Photo-based solutions with guided steps
Explore more problems and detailed explanations
20