QUESTION IMAGE
Question
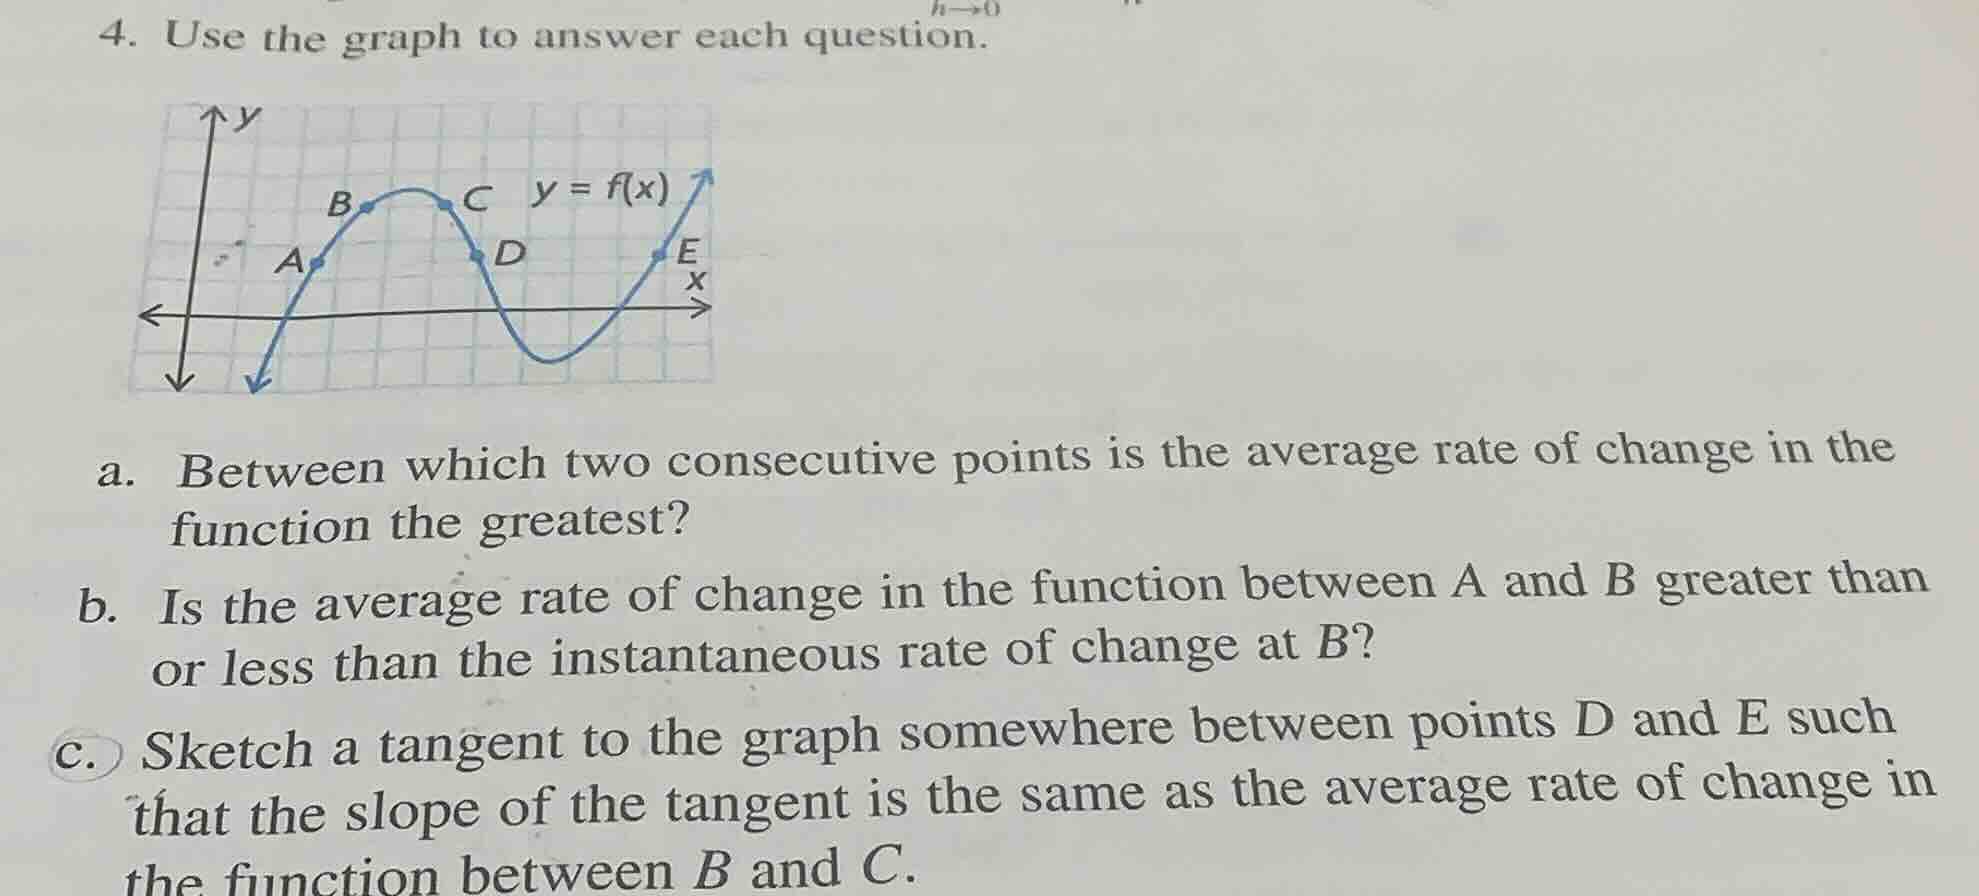
- use the graph to answer each question.
a. between which two consecutive points is the average rate of change in the function the greatest?
b. is the average rate of change in the function between a and b greater than or less than the instantaneous rate of change at b?
c. sketch a tangent to the graph somewhere between points d and e such that the slope of the tangent is the same as the average rate of change in the function between b and c.
Part a
Step1: Recall Average Rate of Change Formula
The average rate of change between two points \((x_1, y_1)\) and \((x_2, y_2)\) is given by \(\frac{f(x_2)-f(x_1)}{x_2 - x_1}\), which represents the slope of the secant line connecting the two points.
Step2: Analyze Slopes Between Consecutive Points
- Between \(A\) and \(B\): The function is increasing, but the slope of the secant is moderate.
- Between \(B\) and \(C\): The function is either increasing at a slower rate or even decreasing slightly (since it's near the peak), so the slope of the secant is small (maybe zero or slightly positive/negative).
- Between \(C\) and \(D\): The function is decreasing, so the slope of the secant is negative.
- Between \(D\) and \(E\): The function is increasing, and visually, the vertical change (rise) over the horizontal change (run) is the largest among all consecutive pairs. The graph rises steeply from \(D\) to \(E\) compared to other intervals.
Step1: Recall Instantaneous Rate of Change
The instantaneous rate of change at a point \(B\) is the slope of the tangent line at \(B\).
Step2: Compare Slopes
- The average rate of change between \(A\) and \(B\) is the slope of the secant line \(AB\).
- At point \(B\), the function is near the peak (or at the peak's vicinity). The tangent line at \(B\) will have a slope close to zero (since it's a local maximum or near it, the slope of the tangent is zero or very small positive/negative). The secant line \(AB\) has a positive slope (since the function is increasing from \(A\) to \(B\)). Wait, actually, if \(B\) is a local maximum, the tangent at \(B\) has slope zero. The average rate of change from \(A\) to \(B\) is positive (since \(f(B)>f(A)\)). But wait, maybe my initial thought was wrong. Wait, when moving from \(A\) to \(B\), the function is increasing, so the secant slope is positive. At \(B\), which is a local maximum, the tangent slope is zero (or close to zero). So the average rate of change between \(A\) and \(B\) (positive slope) is greater than the instantaneous rate of change at \(B\) (slope of tangent, which is zero or near zero). Wait, no—wait, if \(B\) is a local maximum, the tangent at \(B\) has slope zero. The secant from \(A\) to \(B\) has a positive slope (since \(y\) increases from \(A\) to \(B\)). So the average rate of change (positive) is greater than the instantaneous rate of change at \(B\) (zero). But wait, maybe the graph: if \(B\) is on the way up to the peak, then the tangent at \(B\) would have a slope, and the secant from \(A\) to \(B\) would have a slope. Wait, actually, when a function is concave down (like a parabola opening down), the slope of the secant between two points on the increasing part is less than the slope of the tangent at the right - hand point. Wait, let's think again. Suppose the function is increasing from \(A\) to \(B\) to \(C\) (with \(B\) and \(C\) near the peak). The tangent at \(B\) (if it's a local maximum) has slope zero. The secant from \(A\) to \(B\) has a positive slope. So the average rate of change (secant slope) is greater than the instantaneous rate of change (tangent slope at \(B\), which is zero). But maybe the graph is such that \(B\) is not a local maximum but just a point on the increasing part before the peak. Wait, the graph shows \(B\) and \(C\) as points on the peak. So at \(B\), the tangent slope is zero (local maximum). The secant from \(A\) to \(B\) has a positive slope. So the average rate of change between \(A\) and \(B\) is greater than the instantaneous rate of change at \(B\).
Step1: Find Slope Between \(B\) and \(C\)
First, find the slope of the secant line between \(B\) and \(C\). Since \(B\) and \(C\) are on a horizontal (or nearly horizontal) part of the graph (near the peak), the slope of the secant \(BC\) is approximately zero (because \(f(B)\approx f(C)\), so \(\frac{f(C)-f(B)}{C - B}\approx0\)).
Step2: Sketch Tangent Between \(D\) and \(E\)
We need to sketch a tangent line between \(D\) and \(E\) with slope equal to the slope of \(BC\) (which is approximately zero). So we draw a horizontal tangent line (slope zero) somewhere between \(D\) and \(E\) on the graph of \(y = f(x)\). This tangent line should be horizontal, just like the secant line \(BC\) (which is also horizontal or nearly horizontal).

Snap & solve any problem in the app
Get step-by-step solutions on Sovi AI
Photo-based solutions with guided steps
Explore more problems and detailed explanations
Between points \(D\) and \(E\) the average rate of change is the greatest.