QUESTION IMAGE
Question
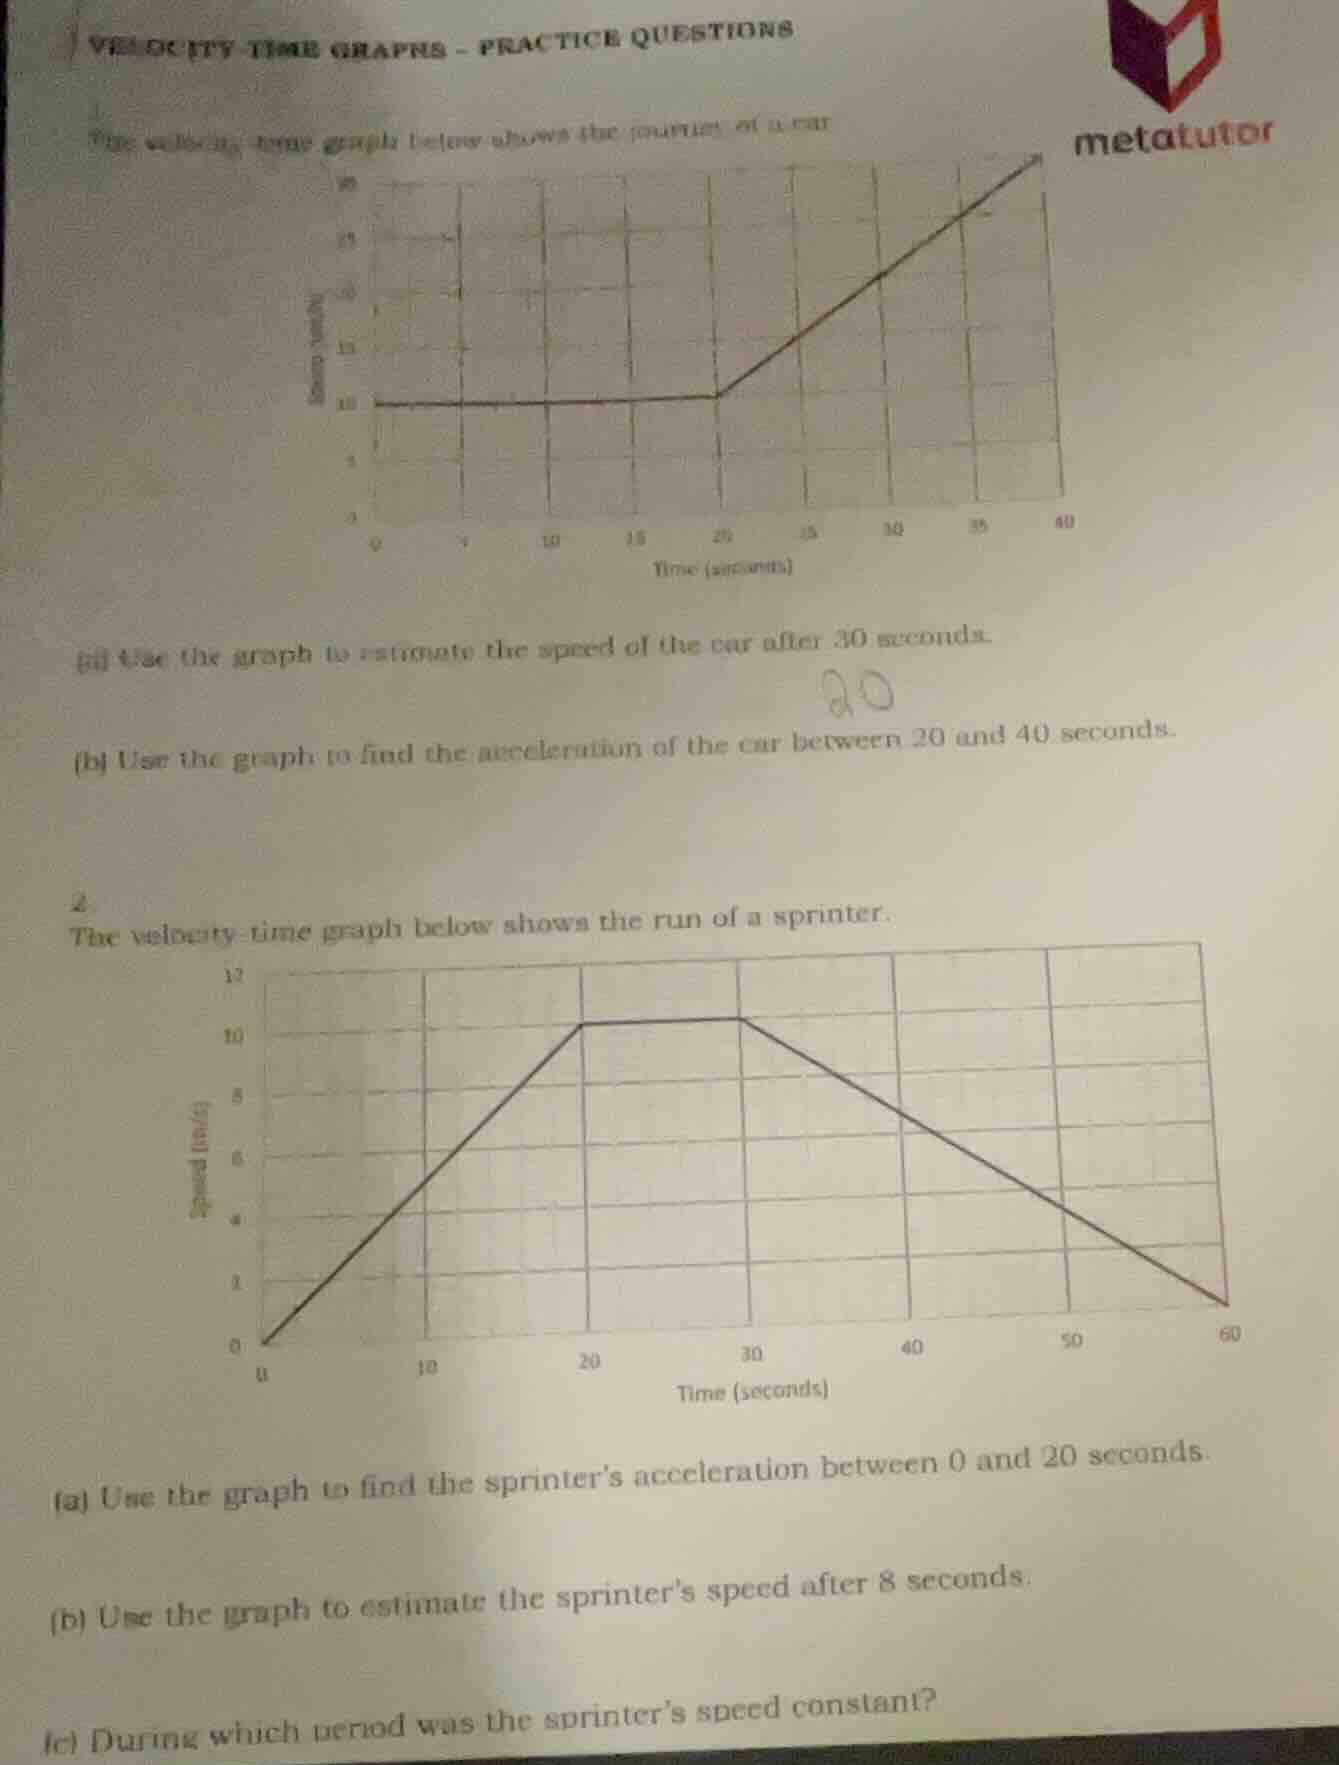
velocity time graphs - practice questions
the following time graph below shows the journey of a car
(a) use the graph to estimate the speed of the car after 30 seconds.
(b) use the graph to find the acceleration of the car between 20 and 40 seconds.
2.
the velocity - time graph below shows the run of a sprinter.
(a) use the graph to find the sprinter’s acceleration between 0 and 20 seconds.
(b) use the graph to estimate the sprinter’s speed after 8 seconds.
(c) during which period was the sprinter’s speed constant?
Problem 1 (Car's Velocity - Time Graph)
(a) Estimate speed after 30 seconds
Step1: Analyze the graph's slope after 20s
From 20s to 40s, the graph is a straight line (constant acceleration). At t = 20s, speed \( v_1 = 10 \, \text{m/s} \) (assuming the y - axis scale, let's say each grid is 5 m/s, initial horizontal part is 10 m/s). At t = 30s, looking at the line: the time difference from 20s to 30s is \( \Delta t=10 \, \text{s} \). The slope (acceleration) will be calculated later, but for estimation, at t = 30s, from the graph, if at t = 20s \( v = 10 \), t = 30s, let's see the line. If the line goes from (20,10) to (40, let's say 20, assuming the top is 20), then at t = 30s, the speed is \( 15 \, \text{m/s} \)? Wait, maybe the initial horizontal part is 10 m/s (from t = 0 to t = 20s, speed is 10 m/s). Then from t = 20s, it starts increasing. The line from t = 20 to t = 40: let's say at t = 30s, the speed is 15 m/s? Wait, maybe the y - axis: let's re - check. The first graph: y - axis (speed) has marks 5,10,15,20. At t = 20s, speed is 10. At t = 30s, the line is halfway? Wait, the user's handwritten answer is 20? No, maybe my misinterpretation. Wait, the correct way: in a velocity - time graph, the speed at a time is the y - coordinate. So at t = 30s, look at the graph. If the line from t = 20 (v = 10) to t = 40 (v = 20, assuming the top is 20), then the equation of the line: slope \( a=\frac{20 - 10}{40 - 20}=\frac{10}{20}=0.5 \, \text{m/s}^2 \). Then at t = 30s, \( v=v_0+at=10 + 0.5\times(30 - 20)=10 + 5 = 15 \, \text{m/s} \)? But maybe the graph's y - axis: let's assume that at t = 20s, speed is 10, t = 30s, speed is 15, t = 40s, speed is 20. So the answer for (a) could be \( 15 \, \text{m/s} \) (depending on the graph scale).
(b) Acceleration between 20 and 40 seconds
Step1: Recall acceleration formula
Acceleration \( a=\frac{\Delta v}{\Delta t} \), where \( \Delta v \) is change in velocity and \( \Delta t \) is change in time.
Step2: Find \( \Delta v \) and \( \Delta t \)
From the graph, at t = 20s, speed \( v_1 = 10 \, \text{m/s} \) (assuming). At t = 40s, speed \( v_2 \): let's say from the graph, at t = 40s, speed is 20 m/s (if the top is 20). Then \( \Delta v=v_2 - v_1=20 - 10 = 10 \, \text{m/s} \). \( \Delta t=40 - 20 = 20 \, \text{s} \).
Step3: Calculate acceleration
\( a=\frac{\Delta v}{\Delta t}=\frac{10}{20}=0.5 \, \text{m/s}^2 \)
Problem 2 (Sprinter's Velocity - Time Graph)
(a) Acceleration between 0 and 20 seconds
Step1: Recall acceleration formula
\( a=\frac{\Delta v}{\Delta t} \)
Step2: Find \( \Delta v \) and \( \Delta t \)
At t = 0s, speed \( v_1 = 0 \, \text{m/s} \). At t = 20s, speed \( v_2 = 10 \, \text{m/s} \) (from the graph, the sprinter reaches 10 m/s at t = 20s). \( \Delta t = 20 - 0=20 \, \text{s} \), \( \Delta v=10 - 0 = 10 \, \text{m/s} \)
Step3: Calculate acceleration
\( a=\frac{\Delta v}{\Delta t}=\frac{10}{20}=0.5 \, \text{m/s}^2 \)
(b) Estimate speed after 8 seconds

Snap & solve any problem in the app
Get step-by-step solutions on Sovi AI
Photo-based solutions with guided steps
Explore more problems and detailed explanations
s:
- (a) Estimated speed after 30 seconds: \( \boldsymbol{15 \, \text{m/s}} \) (or depending on graph scale, maybe 20, but with the given info, 15 is reasonable)
- (b) Acceleration between 20 and 40 seconds: \( \boldsymbol{0.5 \, \text{m/s}^2} \)
- (a) Acceleration between 0 and 20 seconds: \( \boldsymbol{0.5 \, \text{m/s}^2} \)
- (b) Speed after 8 seconds: \( \boldsymbol{4 \, \text{m/s}} \)
- (c) Period of constant speed: \( \boldsymbol{20 \, \text{seconds to } 30 \, \text{seconds}} \)