QUESTION IMAGE
Question
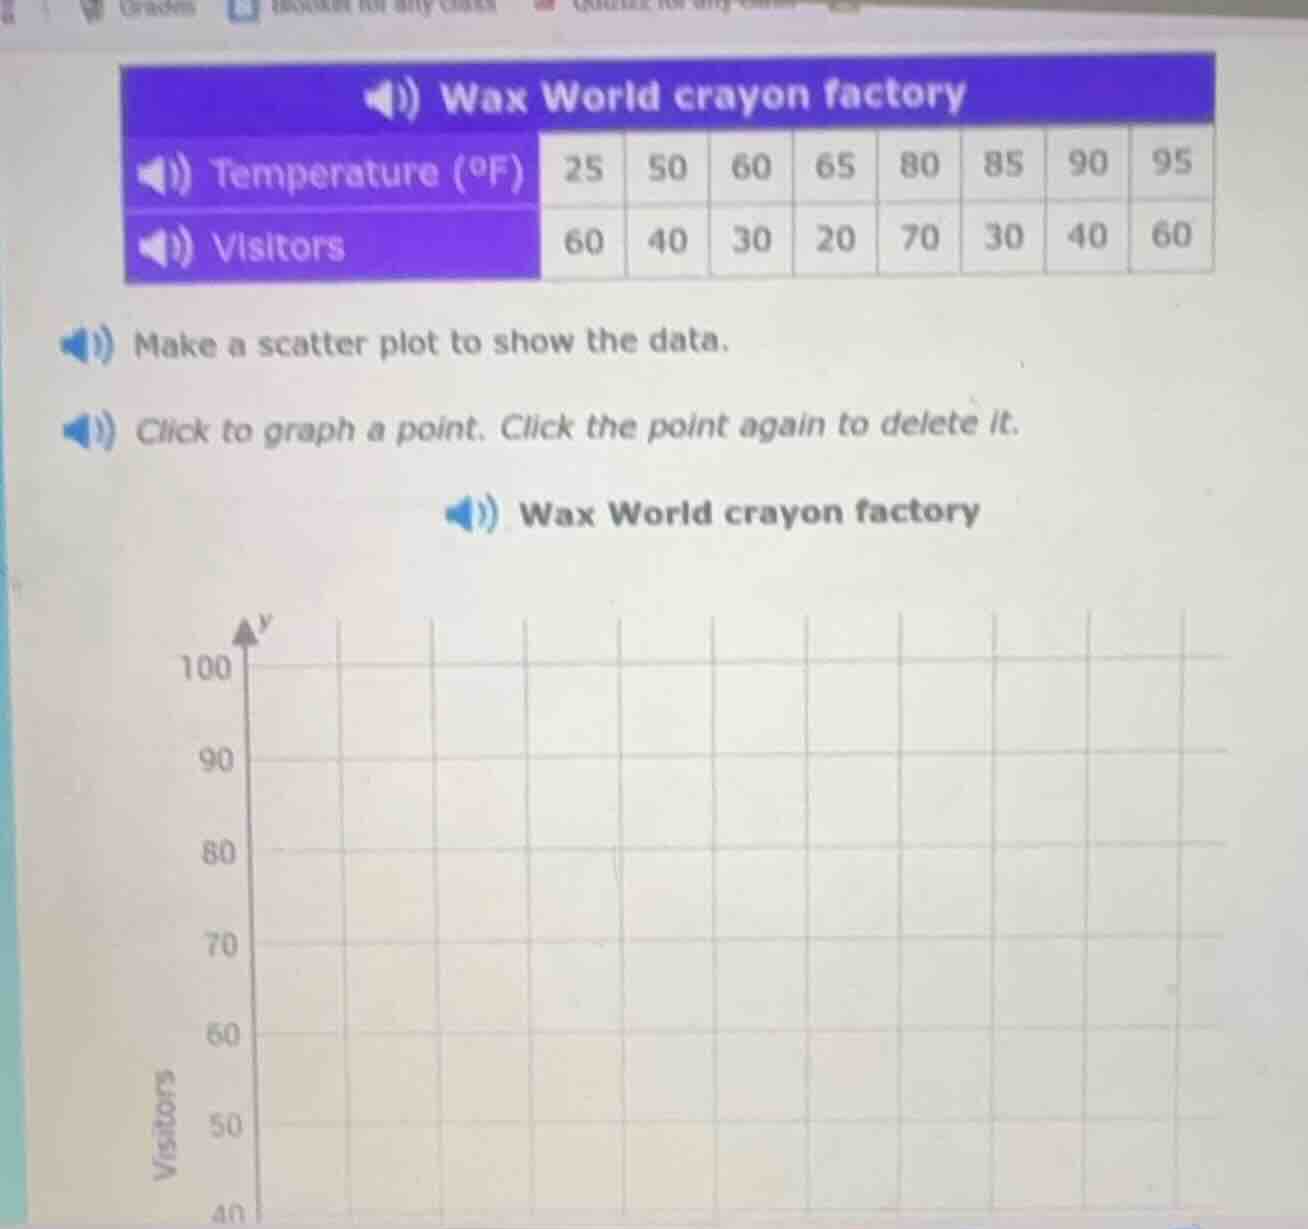
wax world crayon factory
temperature (°f) 25 50 60 65 80 85 90 95
visitors 60 40 30 20 70 30 40 60
make a scatter plot to show the data.
click to graph a point. click the point again to delete it.
wax world crayon factory
(graph with y - axis labeled visitors from 40 to 100 and x - axis for temperature)
Step1: Identify x and y variables
x - Temperature (\(^\circ\)F), y - Visitors.
Step2: Plot each data point
- (25, 60): Find x=25, y=60 on axes, mark point.
- (50, 40): x=50, y=40, mark.
- (60, 30): x=60, y=30, mark.
- (65, 20): x=65, y=20, mark.
- (80, 70): x=80, y=70, mark.
- (85, 30): x=85, y=30, mark.
- (90, 40): x=90, y=40, mark.
- (95, 60): x=95, y=60, mark.

Snap & solve any problem in the app
Get step-by-step solutions on Sovi AI
Photo-based solutions with guided steps
Explore more problems and detailed explanations
The scatter plot is created by plotting the points (25, 60), (50, 40), (60, 30), (65, 20), (80, 70), (85, 30), (90, 40), (95, 60) on a graph with Temperature (\(^\circ\)F) on the x - axis and Visitors on the y - axis.