QUESTION IMAGE
Question
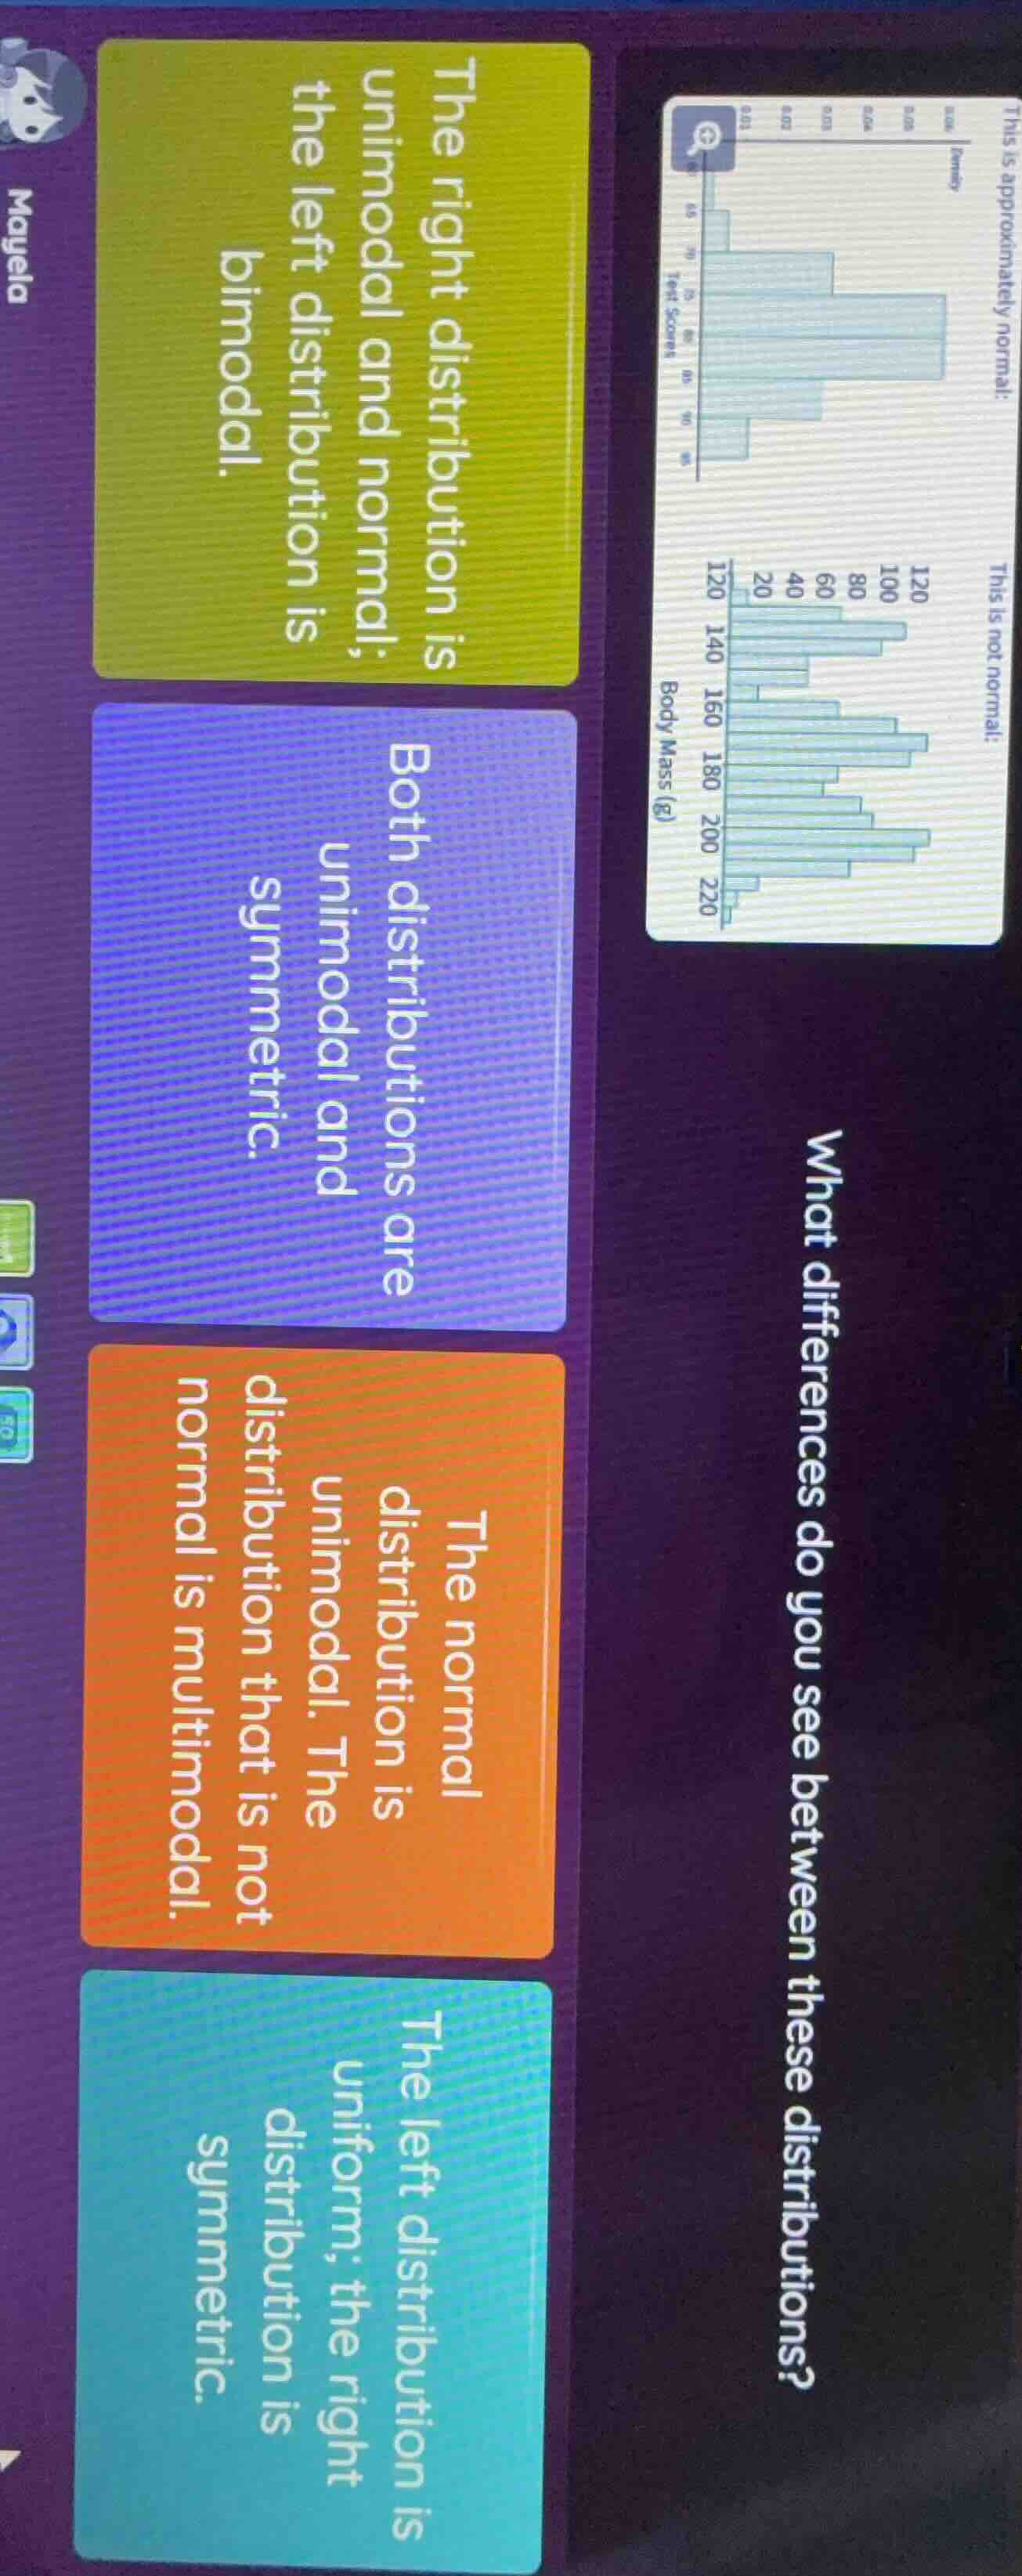
what differences do you see between these distributions?
this is approximately normal:
histogram of test scores
this is not normal:
histogram of body mass (g)
option 1: the right distribution is unimodal and normal; the left distribution is bimodal.
option 2: both distributions are unimodal and symmetric.
option 3: the normal distribution is unimodal. the distribution that is not normal is multimodal.
option 4: the left distribution is uniform; the right distribution is symmetric.
Brief Explanations
- Analyze the top (right) histogram: It is labeled "approximately normal", has one single peak (unimodal), and is symmetric.
- Analyze the bottom (left) histogram: It is labeled "not normal", has two distinct peaks (bimodal), and is not symmetric.
- Match this analysis to the provided options.

Snap & solve any problem in the app
Get step-by-step solutions on Sovi AI
Photo-based solutions with guided steps
Explore more problems and detailed explanations
The right distribution is unimodal and normal; the left distribution is bimodal.