QUESTION IMAGE
Question
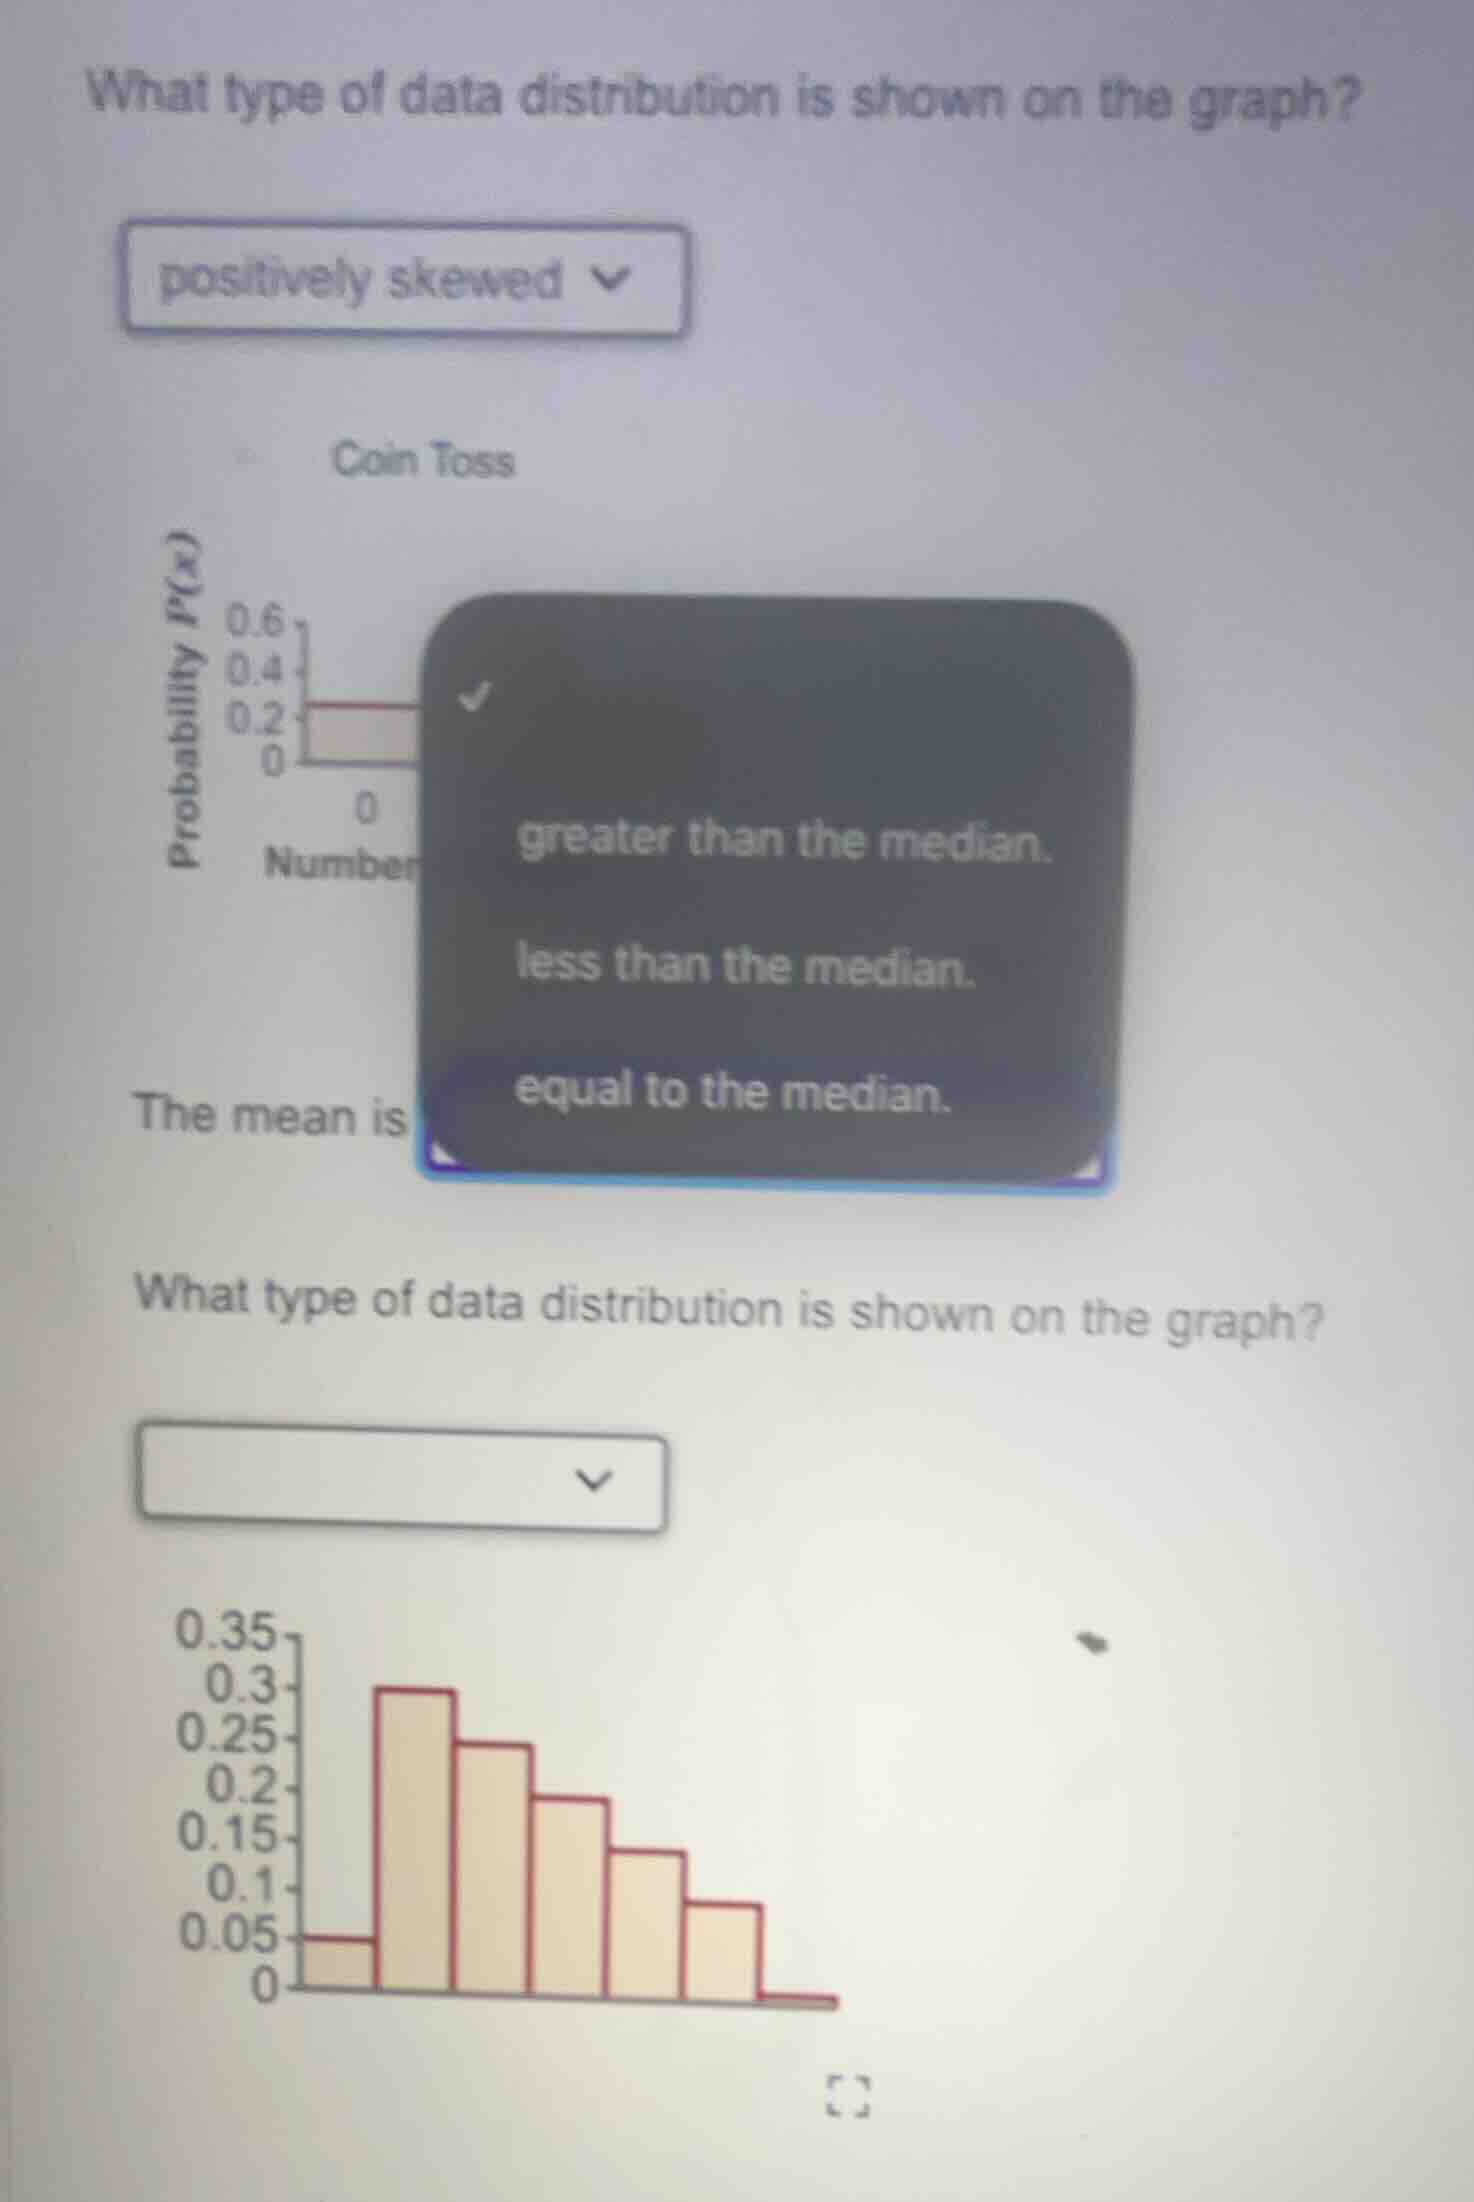
what type of data distribution is shown on the graph?
positively skewed
coin toss
probability p(x)
0.6
0.4
0.2
0
0
number
the mean is
greater than the median.
less than the median.
equal to the median.
what type of data distribution is shown on the graph?
0.35
0.3
0.25
0.2
0.15
0.1
0.05
0
To determine the data distribution type, we analyze the histogram. A right - skewed (positively skewed) distribution has a longer tail on the right side. In this histogram, the bars start with a low frequency on the left, peak, and then the frequencies gradually decrease towards the right, creating a longer tail on the right. This matches the characteristics of a positively skewed distribution. Also, for a positively skewed distribution, the mean is greater than the median, but here we are focused on the distribution type.

Snap & solve any problem in the app
Get step-by-step solutions on Sovi AI
Photo-based solutions with guided steps
Explore more problems and detailed explanations
positively skewed