QUESTION IMAGE
Question
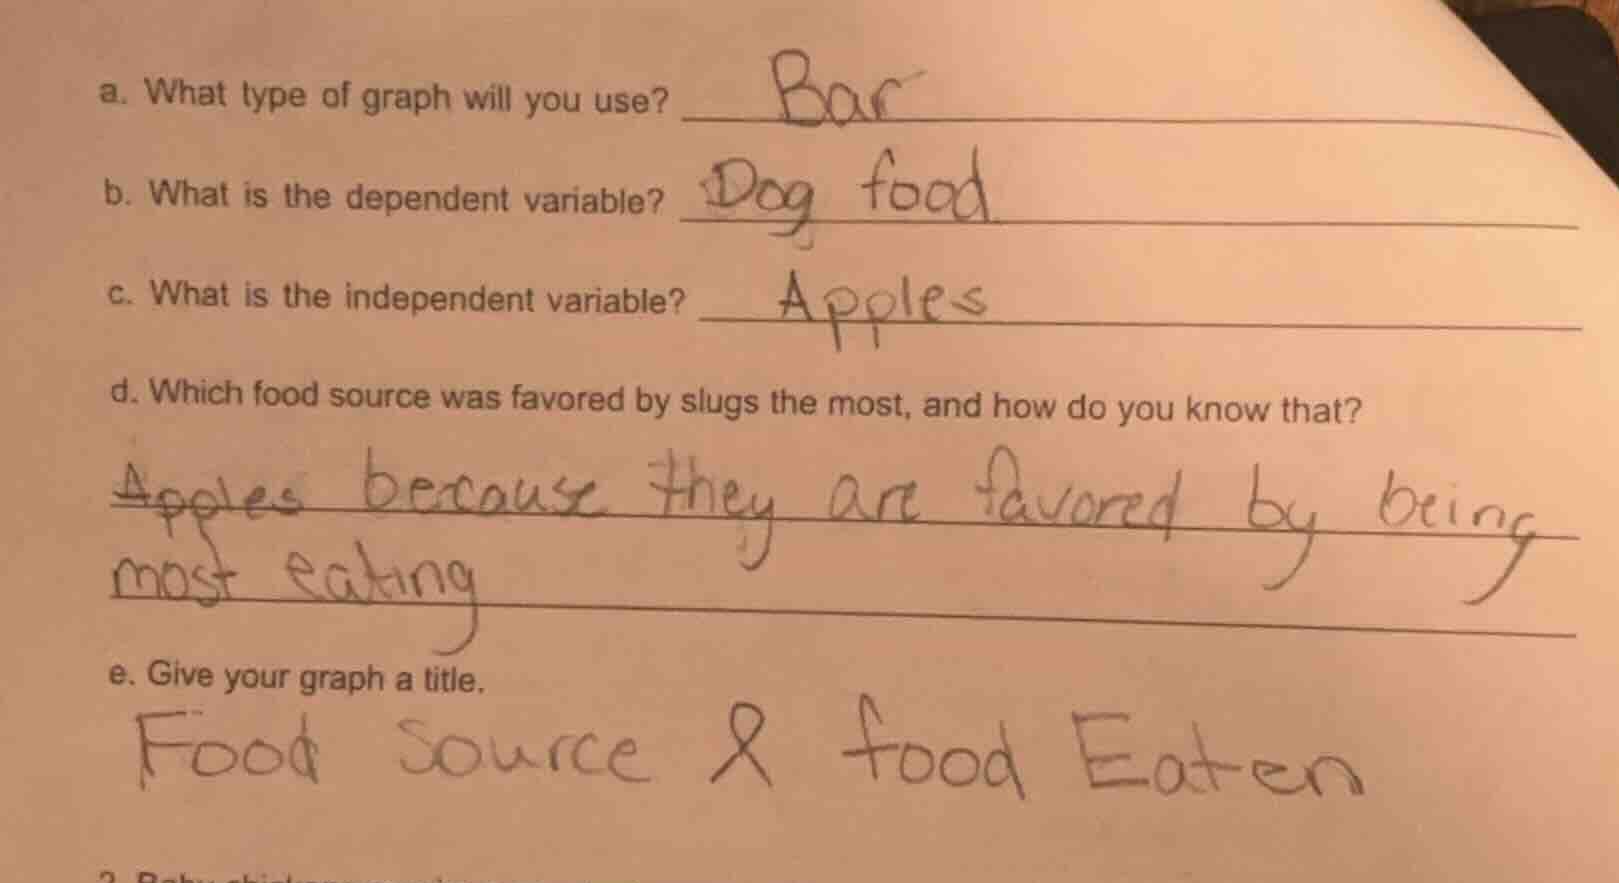
a. what type of graph will you use?
b. what is the dependent variable?
c. what is the independent variable?
d. which food source was favored by slugs the most, and how do you know that?
e. give your graph a title.
Part a
Step1: Determine graph type
A bar graph is suitable for comparing different categories (food sources) and their corresponding values (e.g., amount eaten by slugs). It allows easy visualization of which food source has the highest or lowest value.
The dependent variable depends on the independent variable. In a study about slugs' food preference, the amount (or choice) of food eaten (e.g., how much dog food is eaten) depends on the type of food (independent variable). Here, if we assume the study is about how much of each food slugs eat, the dependent variable is the amount of food consumed (or the preference measure related to dog food, but more accurately, it's the response variable like amount eaten, which in the context of the given answer, if "dog food" is the dependent variable, it might be the amount of dog food eaten, depending on the independent variable (type of food)).
The independent variable is the one that is manipulated or is the cause. In a food preference study for slugs, the type of food (like apples, dog food, etc.) is the independent variable as it's what we change to see the effect on the dependent variable (how much is eaten). The given answer has "Apples" which might be a specific food type, but more generally, the independent variable is the type of food source.

Snap & solve any problem in the app
Get step-by-step solutions on Sovi AI
Photo-based solutions with guided steps
Explore more problems and detailed explanations
Bar graph