QUESTION IMAGE
Question
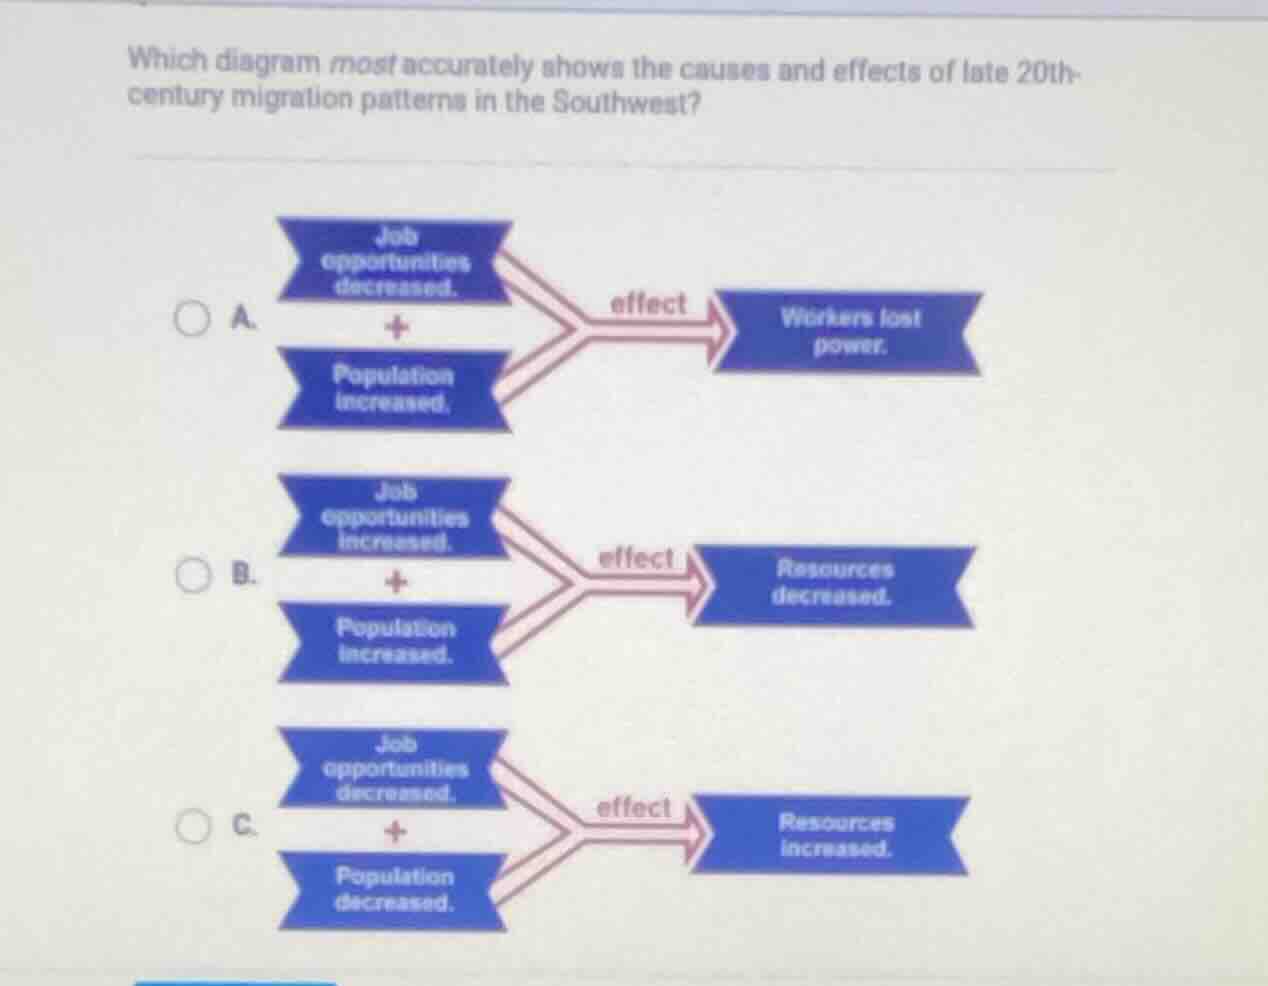
which diagram most accurately shows the causes and effects of late 20th-century migration patterns in the southwest? a. job opportunities decreased. + population increased. effect workers lost power. b. job opportunities increased. + population increased. effect resources decreased. c. job opportunities decreased. + population decreased. effect resources increased.
To determine the correct diagram, we analyze late 20th - century Southwest migration. Job opportunities increasing (due to economic growth) and population increasing (from migration) would put pressure on resources, causing them to decrease. Option A's effect (workers losing power) doesn't relate to migration - resource dynamics. Option C has job opportunities and population decreasing, which is inconsistent with migration trends (migration brings population growth). So Option B's cause - effect (job increase + population increase → resource decrease) matches the context.

Snap & solve any problem in the app
Get step-by-step solutions on Sovi AI
Photo-based solutions with guided steps
Explore more problems and detailed explanations
B. Job opportunities increased. + Population increased. → effect: Resources decreased.