QUESTION IMAGE
Question
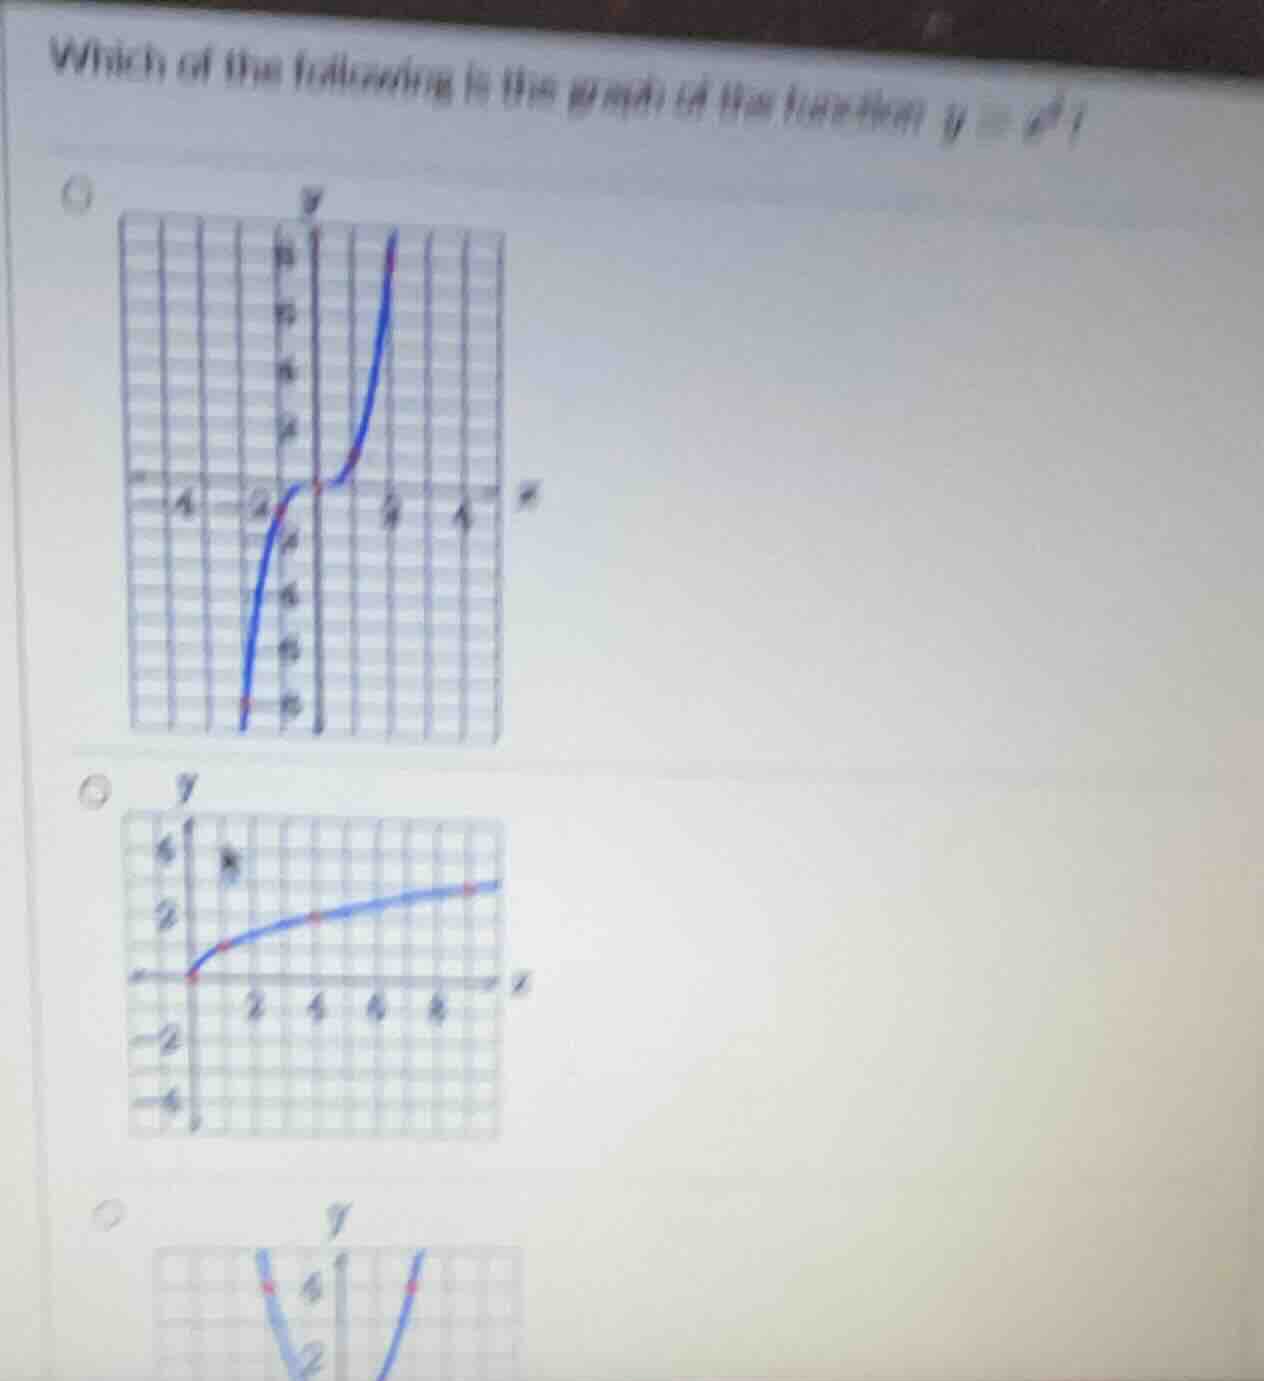
which of the following is the graph of the function $y = x^3$?
Step1: Identify function type
The function $y=e^x$ is an exponential growth function.
Step2: Key properties of $y=e^x$
- When $x=0$, $y=e^0=1$, so it passes through $(0,1)$.
- As $x\to+\infty$, $y\to+\infty$ (grows rapidly).
- As $x\to-\infty$, $y\to0$ (approaches x-axis from above).
- The function is always positive, never crosses the x-axis.
Step3: Match to graphs
- Top graph: Passes through $(0,1)$, grows rapidly for positive $x$, approaches x-axis for negative $x$ (matches all properties).
- Middle graph: Grows very slowly, does not match exponential growth rate.
- Bottom graph: Is a parabola (quadratic function), not exponential.

Snap & solve any problem in the app
Get step-by-step solutions on Sovi AI
Photo-based solutions with guided steps
Explore more problems and detailed explanations
The first (top) graph