QUESTION IMAGE
Question
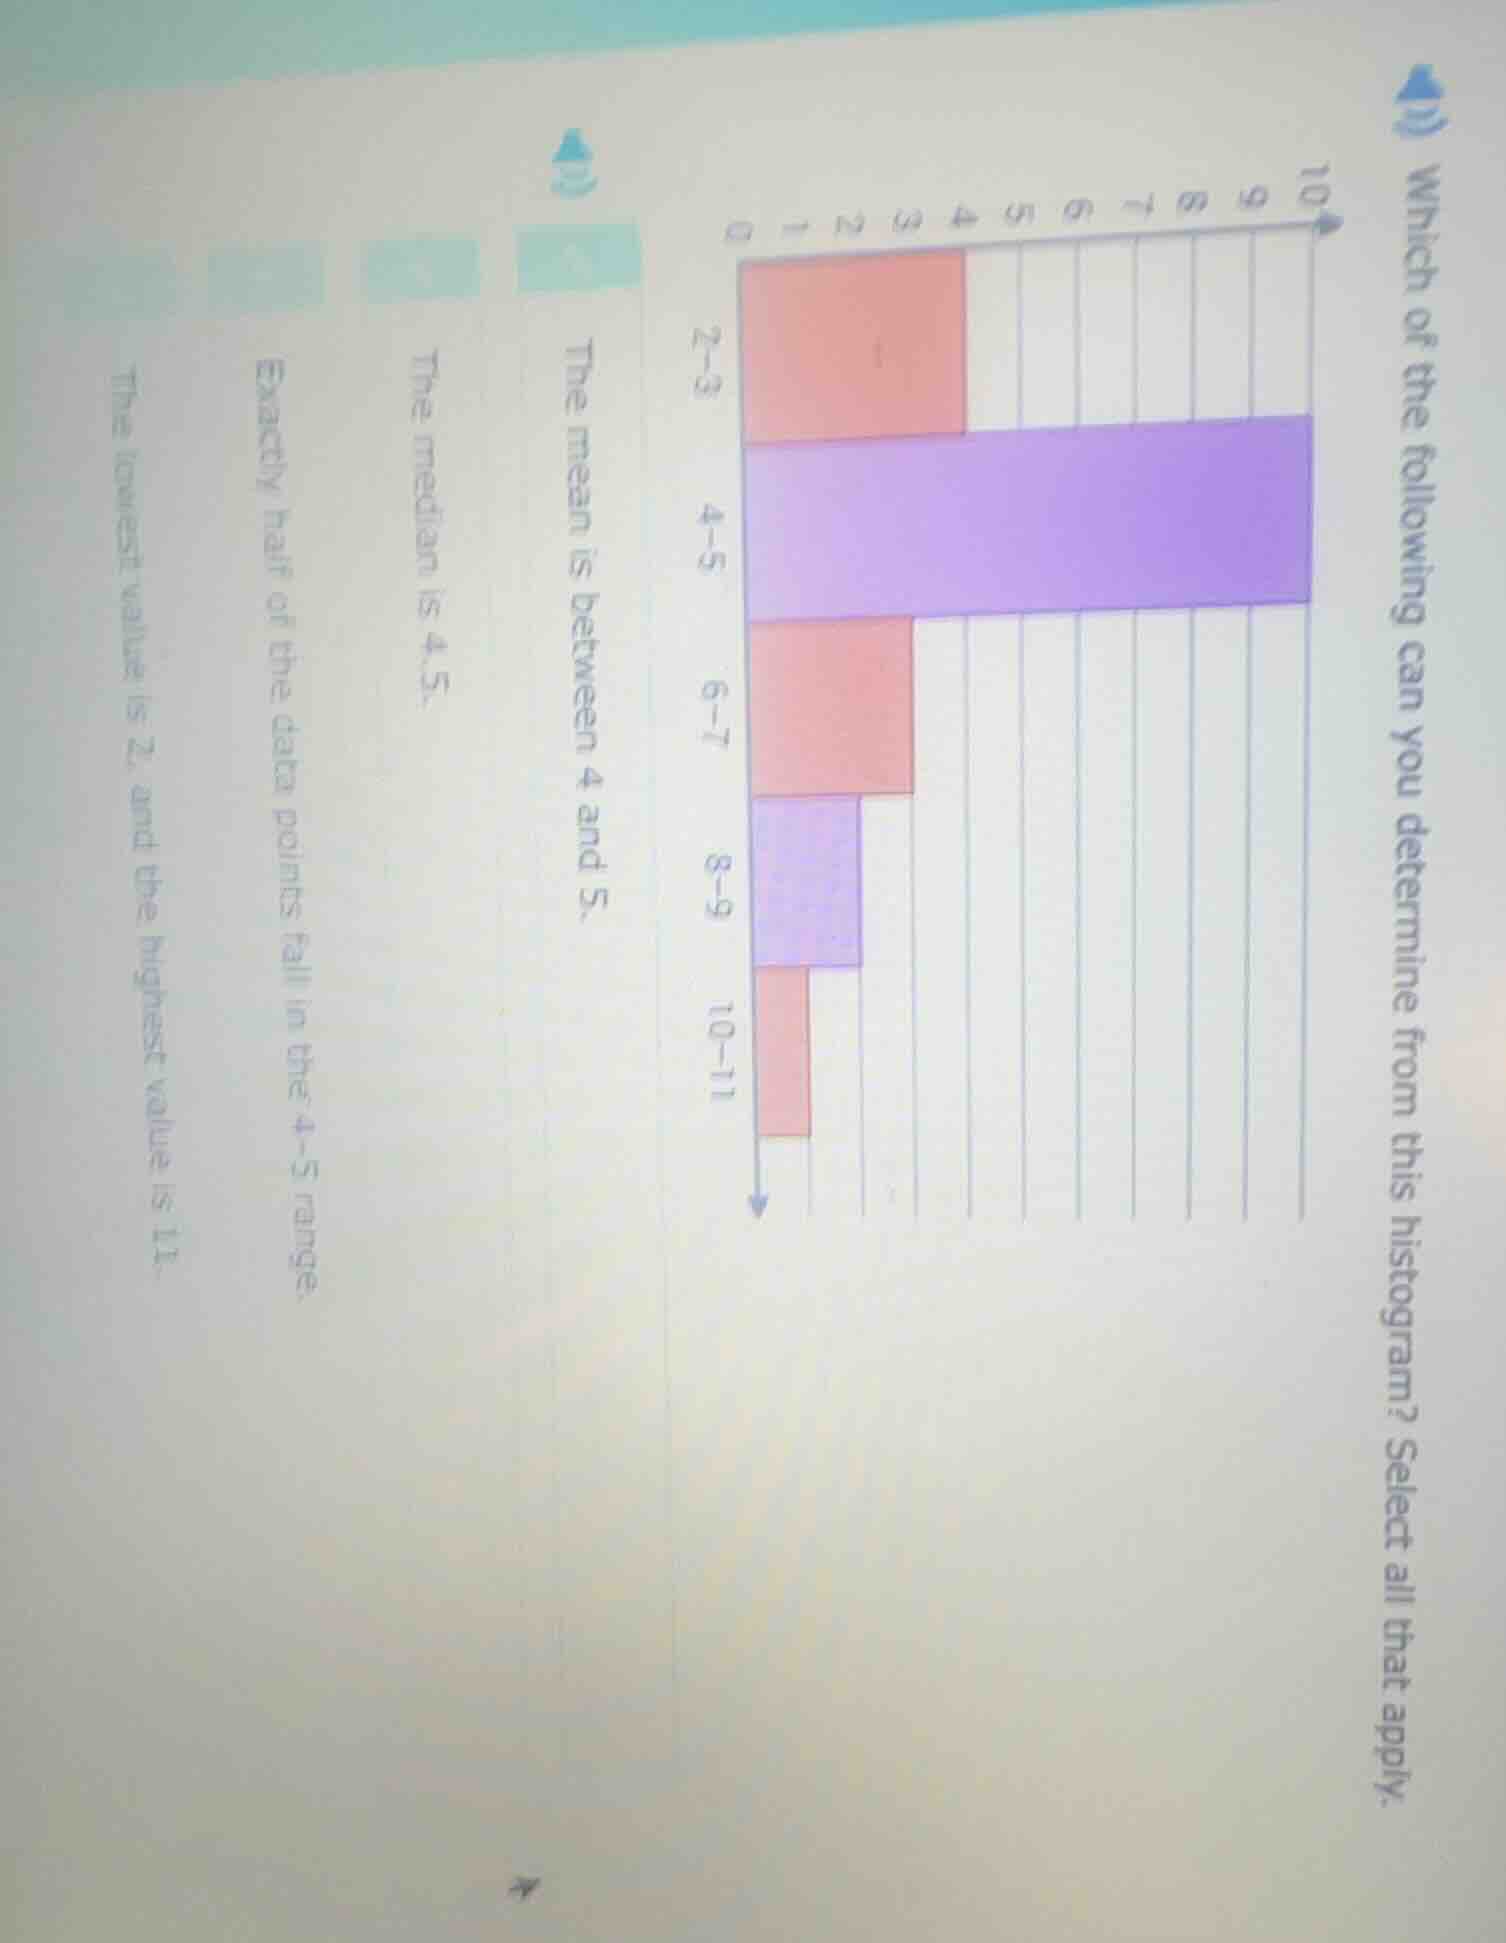
which of the following can you determine from this histogram? select all that apply. the mean is between 4 and 5. the median is 4.5. exactly half of the data points fall in the 4–5 range. the lowest value is 2, and the highest value is 11.
Brief Explanations
- Analyzing "The mean is between 4 and 5":
- The histogram has the largest bar (highest frequency) in the 4 - 5 range. Also, the other bars (2 - 3, 6 - 7, 8 - 9, 10 - 11) have lower frequencies. The mean is affected by the distribution of data. Since the most data is in 4 - 5 and the other data points are relatively balanced around, the mean is likely between 4 and 5.
- Analyzing "The median is 4.5":
- The median is the middle value. The 4 - 5 range is the most frequent, but we don't know the exact number of data points in each interval. We can't be sure the median is exactly 4.5. For example, if there are an odd number of data points or the distribution within the intervals is different, the median might not be 4.5.
- Analyzing "Exactly half of the data points fall in the 4 - 5 range":
- We don't know the total number of data points or the exact number in each interval. Just because 4 - 5 has the highest frequency doesn't mean it's exactly half. The other intervals (2 - 3, 6 - 7, 8 - 9, 10 - 11) also have data, and we can't confirm that 4 - 5 has 50% of the data.
- Analyzing "The lowest value is 2, and the highest value is 11":
- The first interval is 2 - 3, so the lowest value is at least 2, but it could be lower than 2 (the interval is 2 - 3, so data points are in [2, 3)). Similarly, the last interval is 10 - 11, so the highest value is at most 11, but it could be less than 11 (data points in [10, 11)). We can't be sure the lowest is exactly 2 and the highest exactly 11.

Snap & solve any problem in the app
Get step-by-step solutions on Sovi AI
Photo-based solutions with guided steps
Explore more problems and detailed explanations
The mean is between 4 and 5.