QUESTION IMAGE
Question
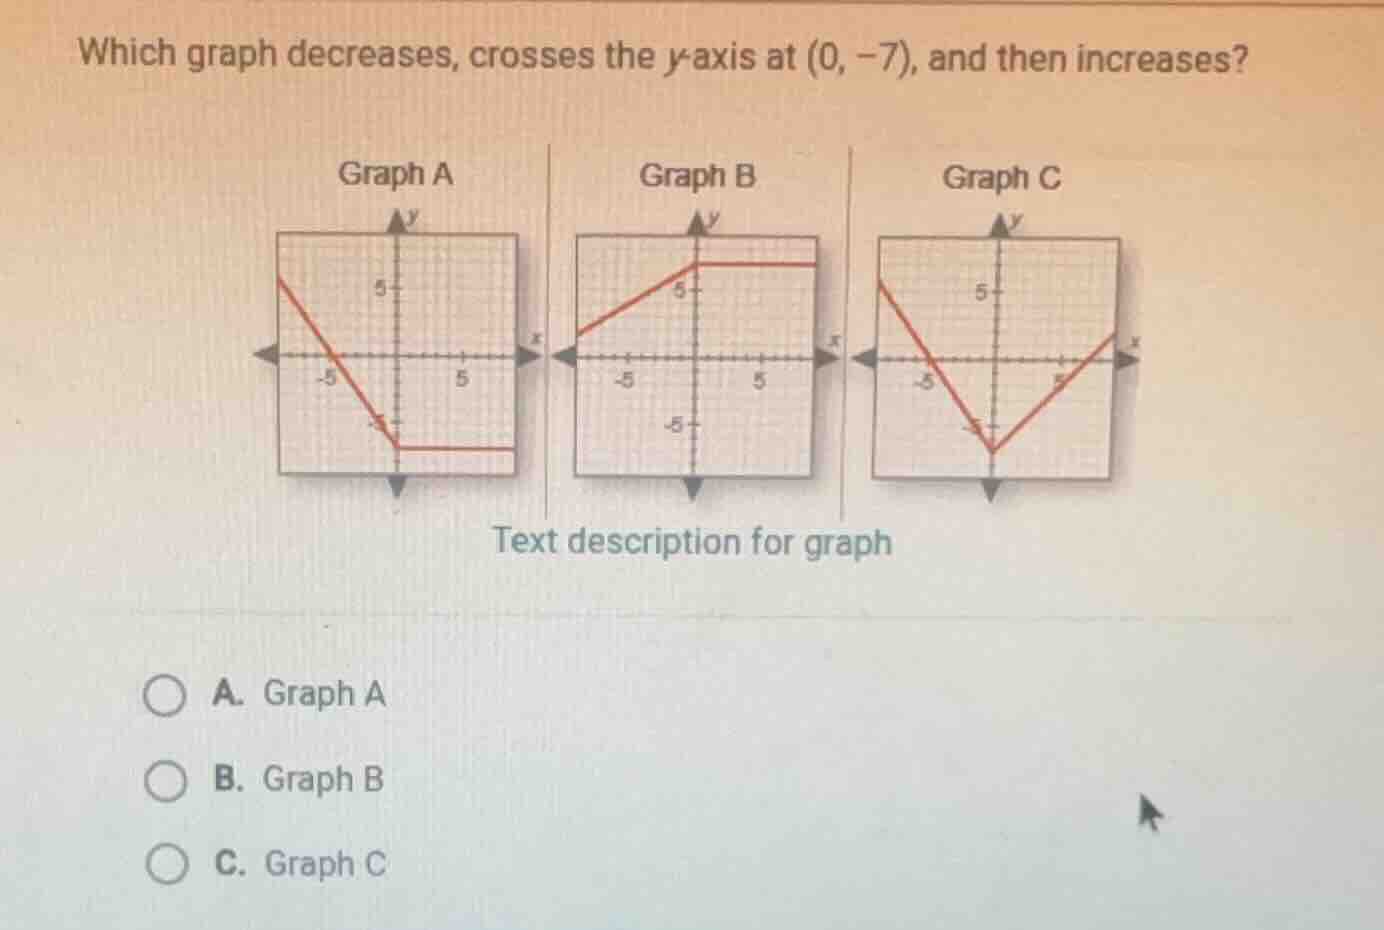
which graph decreases, crosses the y-axis at (0, −7), and then increases? graph a graph b graph c text description for graph a. graph a b. graph b c. graph c
Step1: Analyze Graph A
Graph A first decreases, then becomes constant. It crosses the y - axis at (0, - 5) (not (0, - 7)) and does not increase after the constant part. So Graph A is not the answer.
Step2: Analyze Graph B
Graph B first increases, then becomes constant. It does not have a decreasing part first, so Graph B is not the answer.
Step3: Analyze Graph C
Graph C first decreases (from left to right, the line goes down), crosses the y - axis at (0, - 7) (by looking at the vertex of the V - shaped graph which is on the y - axis at y=-7), and then increases (the right part of the V - shaped graph goes up). So Graph C matches all the given conditions.

Snap & solve any problem in the app
Get step-by-step solutions on Sovi AI
Photo-based solutions with guided steps
Explore more problems and detailed explanations
C. Graph C