QUESTION IMAGE
Question
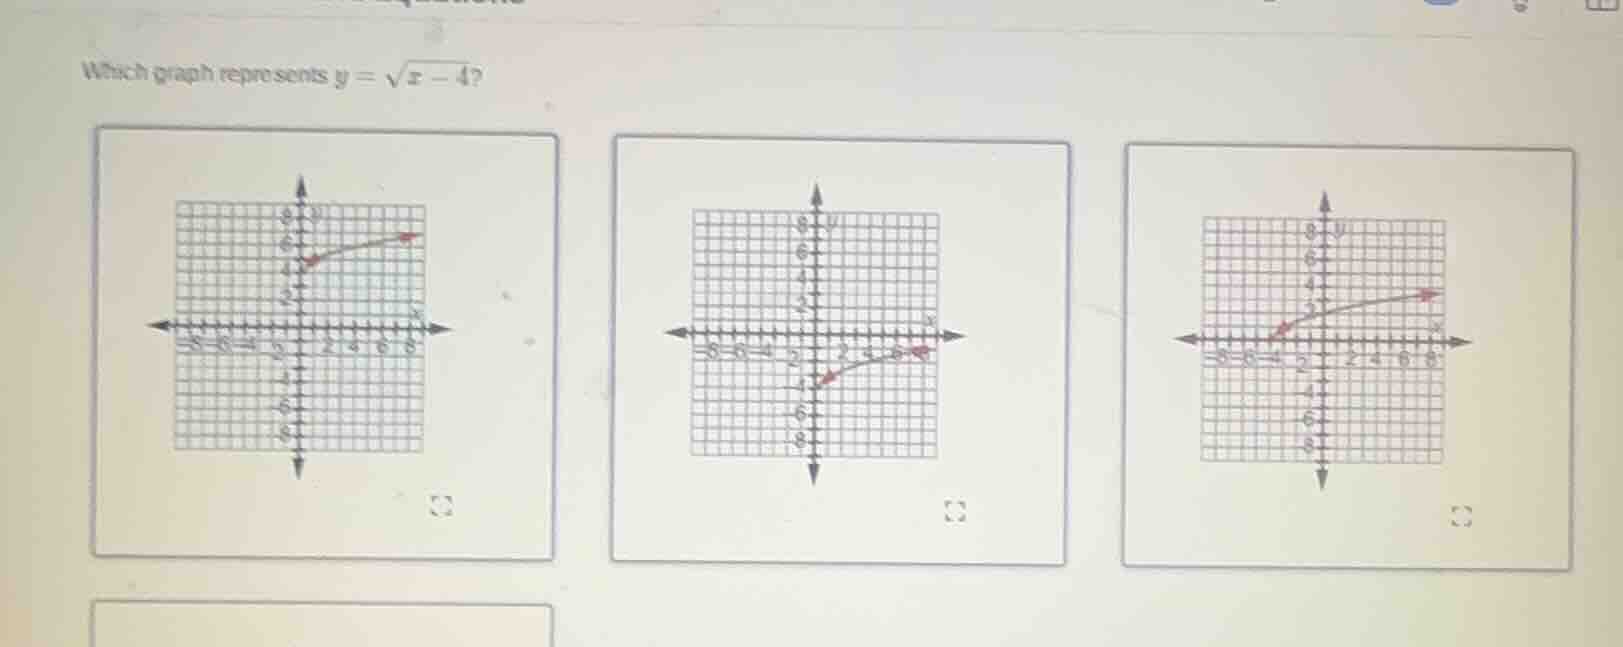
which graph represents $y = \sqrt{x - 4}$? three graphs on a coordinate plane are shown, each with a curve and grid lines. the first graph has a curve starting near (2,4) and increasing, the second near (0,-2) and increasing, the third near (-2,0) and increasing.
Step1: Analyze the parent function
The parent function is \( y = \sqrt{x} \), which has a domain \( x \geq 0 \) and a range \( y \geq 0 \), with its vertex at \( (0, 0) \).
Step2: Determine the transformation
For the function \( y = \sqrt{x - 4} \), this is a horizontal shift of the parent function \( y = \sqrt{x} \). The general form for a horizontal shift of \( y = \sqrt{x} \) is \( y = \sqrt{x - h} \), where \( h \) is the number of units shifted. Here, \( h = 4 \), so the graph of \( y = \sqrt{x} \) is shifted 4 units to the right.
Step3: Find the vertex of the transformed function
The vertex of \( y = \sqrt{x} \) is \( (0, 0) \). After shifting 4 units to the right, the new vertex is \( (4, 0) \).
Step4: Analyze the domain and range
The domain of \( y = \sqrt{x - 4} \) is \( x - 4 \geq 0 \), so \( x \geq 4 \). The range remains \( y \geq 0 \) because the square root function always gives non-negative outputs.
Step5: Match with the graphs
We need to find the graph that has its starting point (vertex) at \( (4, 0) \) and increases as \( x \) increases (since the square root function is increasing for \( x \geq 0 \) in its parent form, and the shift doesn't change the increasing nature). Looking at the options, the third graph (assuming the rightmost one) should have its vertex at \( (4, 0) \) and increase from there, matching the domain \( x \geq 4 \) and range \( y \geq 0 \).

Snap & solve any problem in the app
Get step-by-step solutions on Sovi AI
Photo-based solutions with guided steps
Explore more problems and detailed explanations
The graph with the vertex at \((4, 0)\) (the right - most graph among the three shown) represents \( y=\sqrt{x - 4} \). (Note: Since the exact labels of the graphs are not provided with letters, but based on the analysis, the graph starting at \(x = 4,y = 0\) and increasing is the correct one.)