QUESTION IMAGE
Question
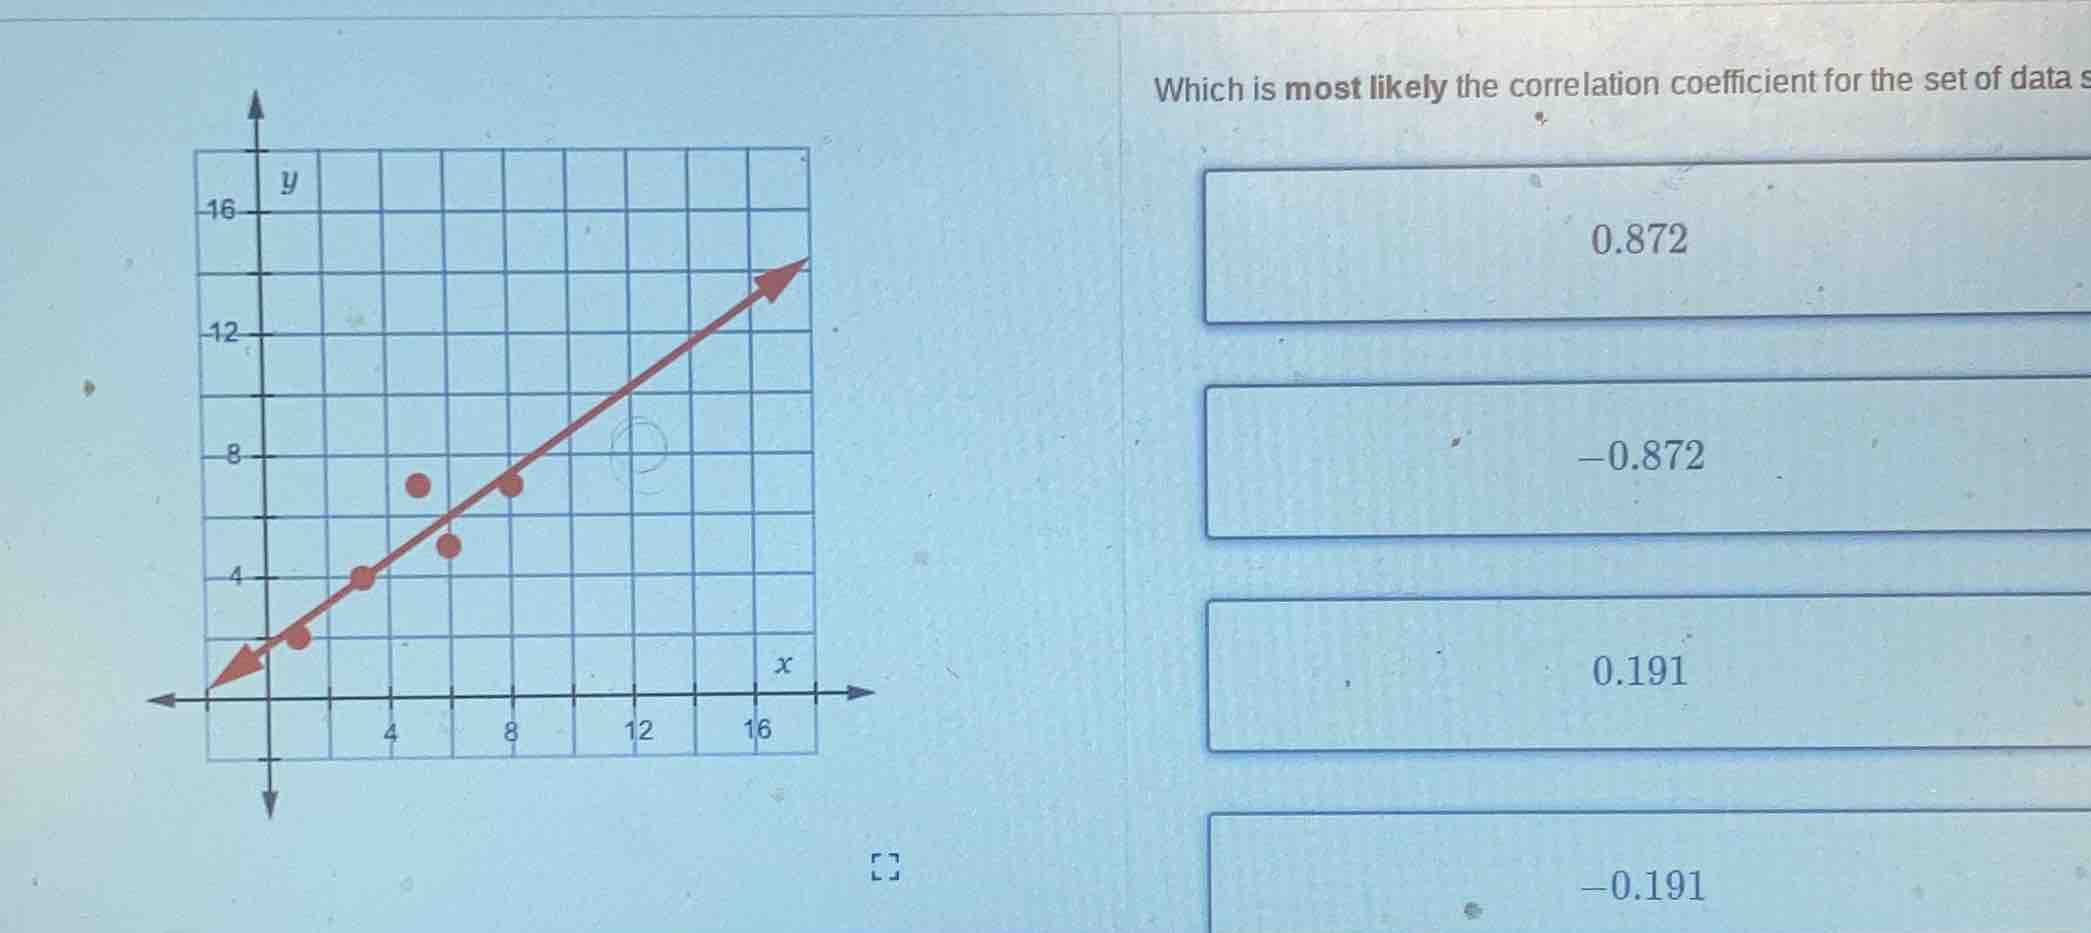
which is most likely the correlation coefficient for the set of data s 0.872 -0.872 0.191 -0.191
Step1: Analyze the trend of the data points
The scatter plot shows that as the \( x \)-values increase, the \( y \)-values also increase. This indicates a positive correlation between \( x \) and \( y \). A positive correlation coefficient is positive, so we can eliminate the options with negative values (\(-0.872\) and \(-0.191\)).
Step2: Analyze the strength of the correlation
The data points are close to the trend line, which means the correlation is strong. A correlation coefficient close to \( 1 \) or \( -1 \) indicates a strong correlation, while a coefficient close to \( 0 \) indicates a weak correlation. Among the remaining positive options, \( 0.872 \) is closer to \( 1 \) (indicating a strong positive correlation) than \( 0.191 \) (which indicates a weak positive correlation).

Snap & solve any problem in the app
Get step-by-step solutions on Sovi AI
Photo-based solutions with guided steps
Explore more problems and detailed explanations
\( 0.872 \)