QUESTION IMAGE
Question
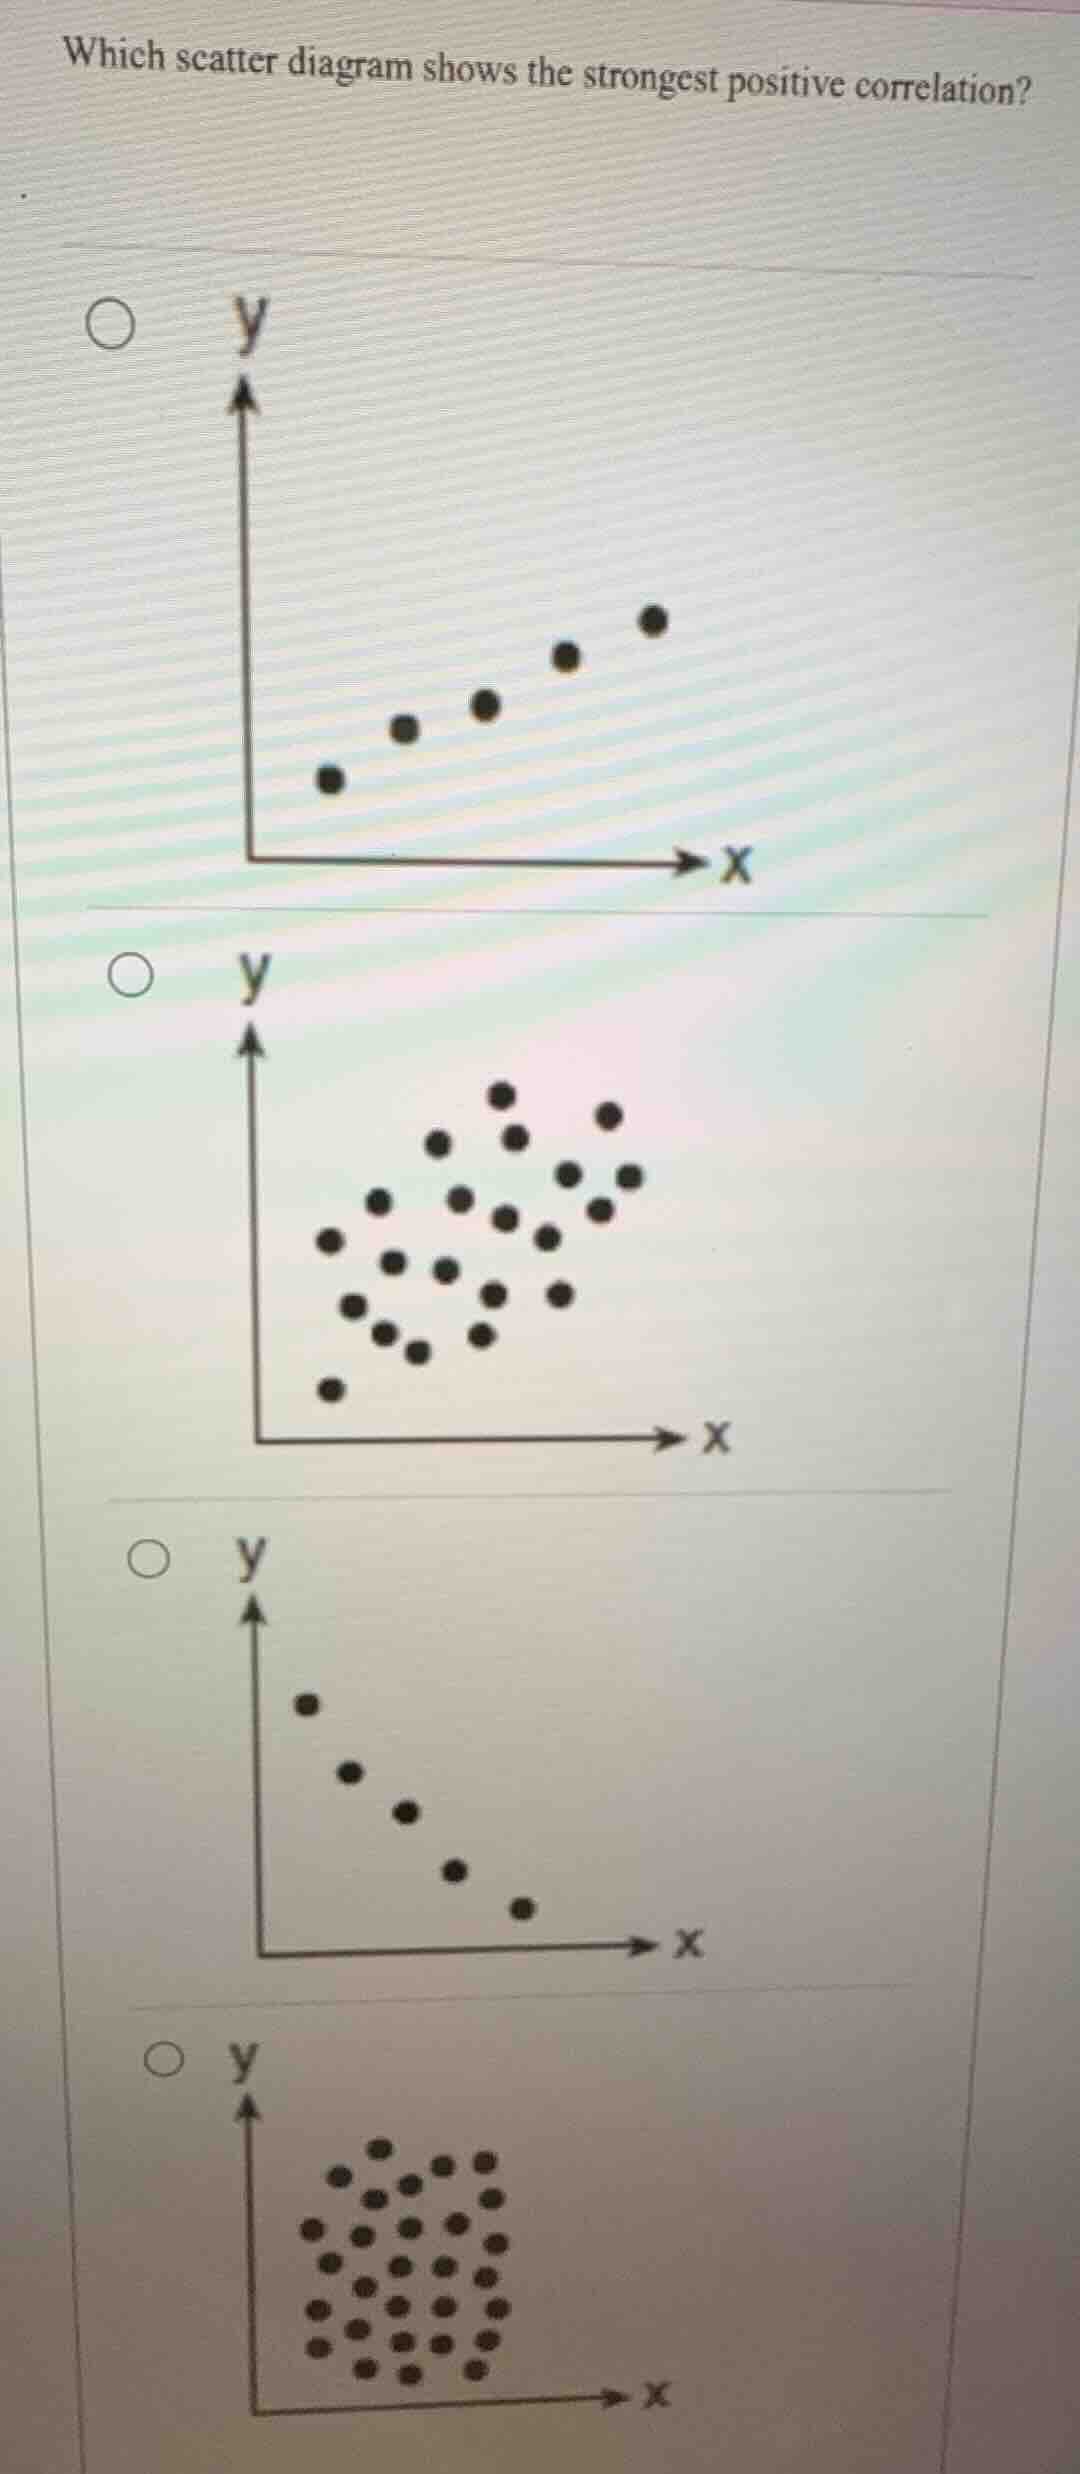
which scatter diagram shows the strongest positive correlation? (four scatter diagrams are presented with radio buttons for selection: first with points increasing, second with scattered points, third with points decreasing, fourth with clustered points)
A positive correlation means as $x$ increases, $y$ increases. The strongest positive correlation has points closest to a straight upward-sloping line. The first graph has tightly clustered points moving up with $x$, the second has a weak positive spread, the third is negative, and the fourth has no correlation.

Snap & solve any problem in the app
Get step-by-step solutions on Sovi AI
Photo-based solutions with guided steps
Explore more problems and detailed explanations
A. The first scatter diagram (with 5 tightly clustered points increasing from left to right)