QUESTION IMAGE
Question
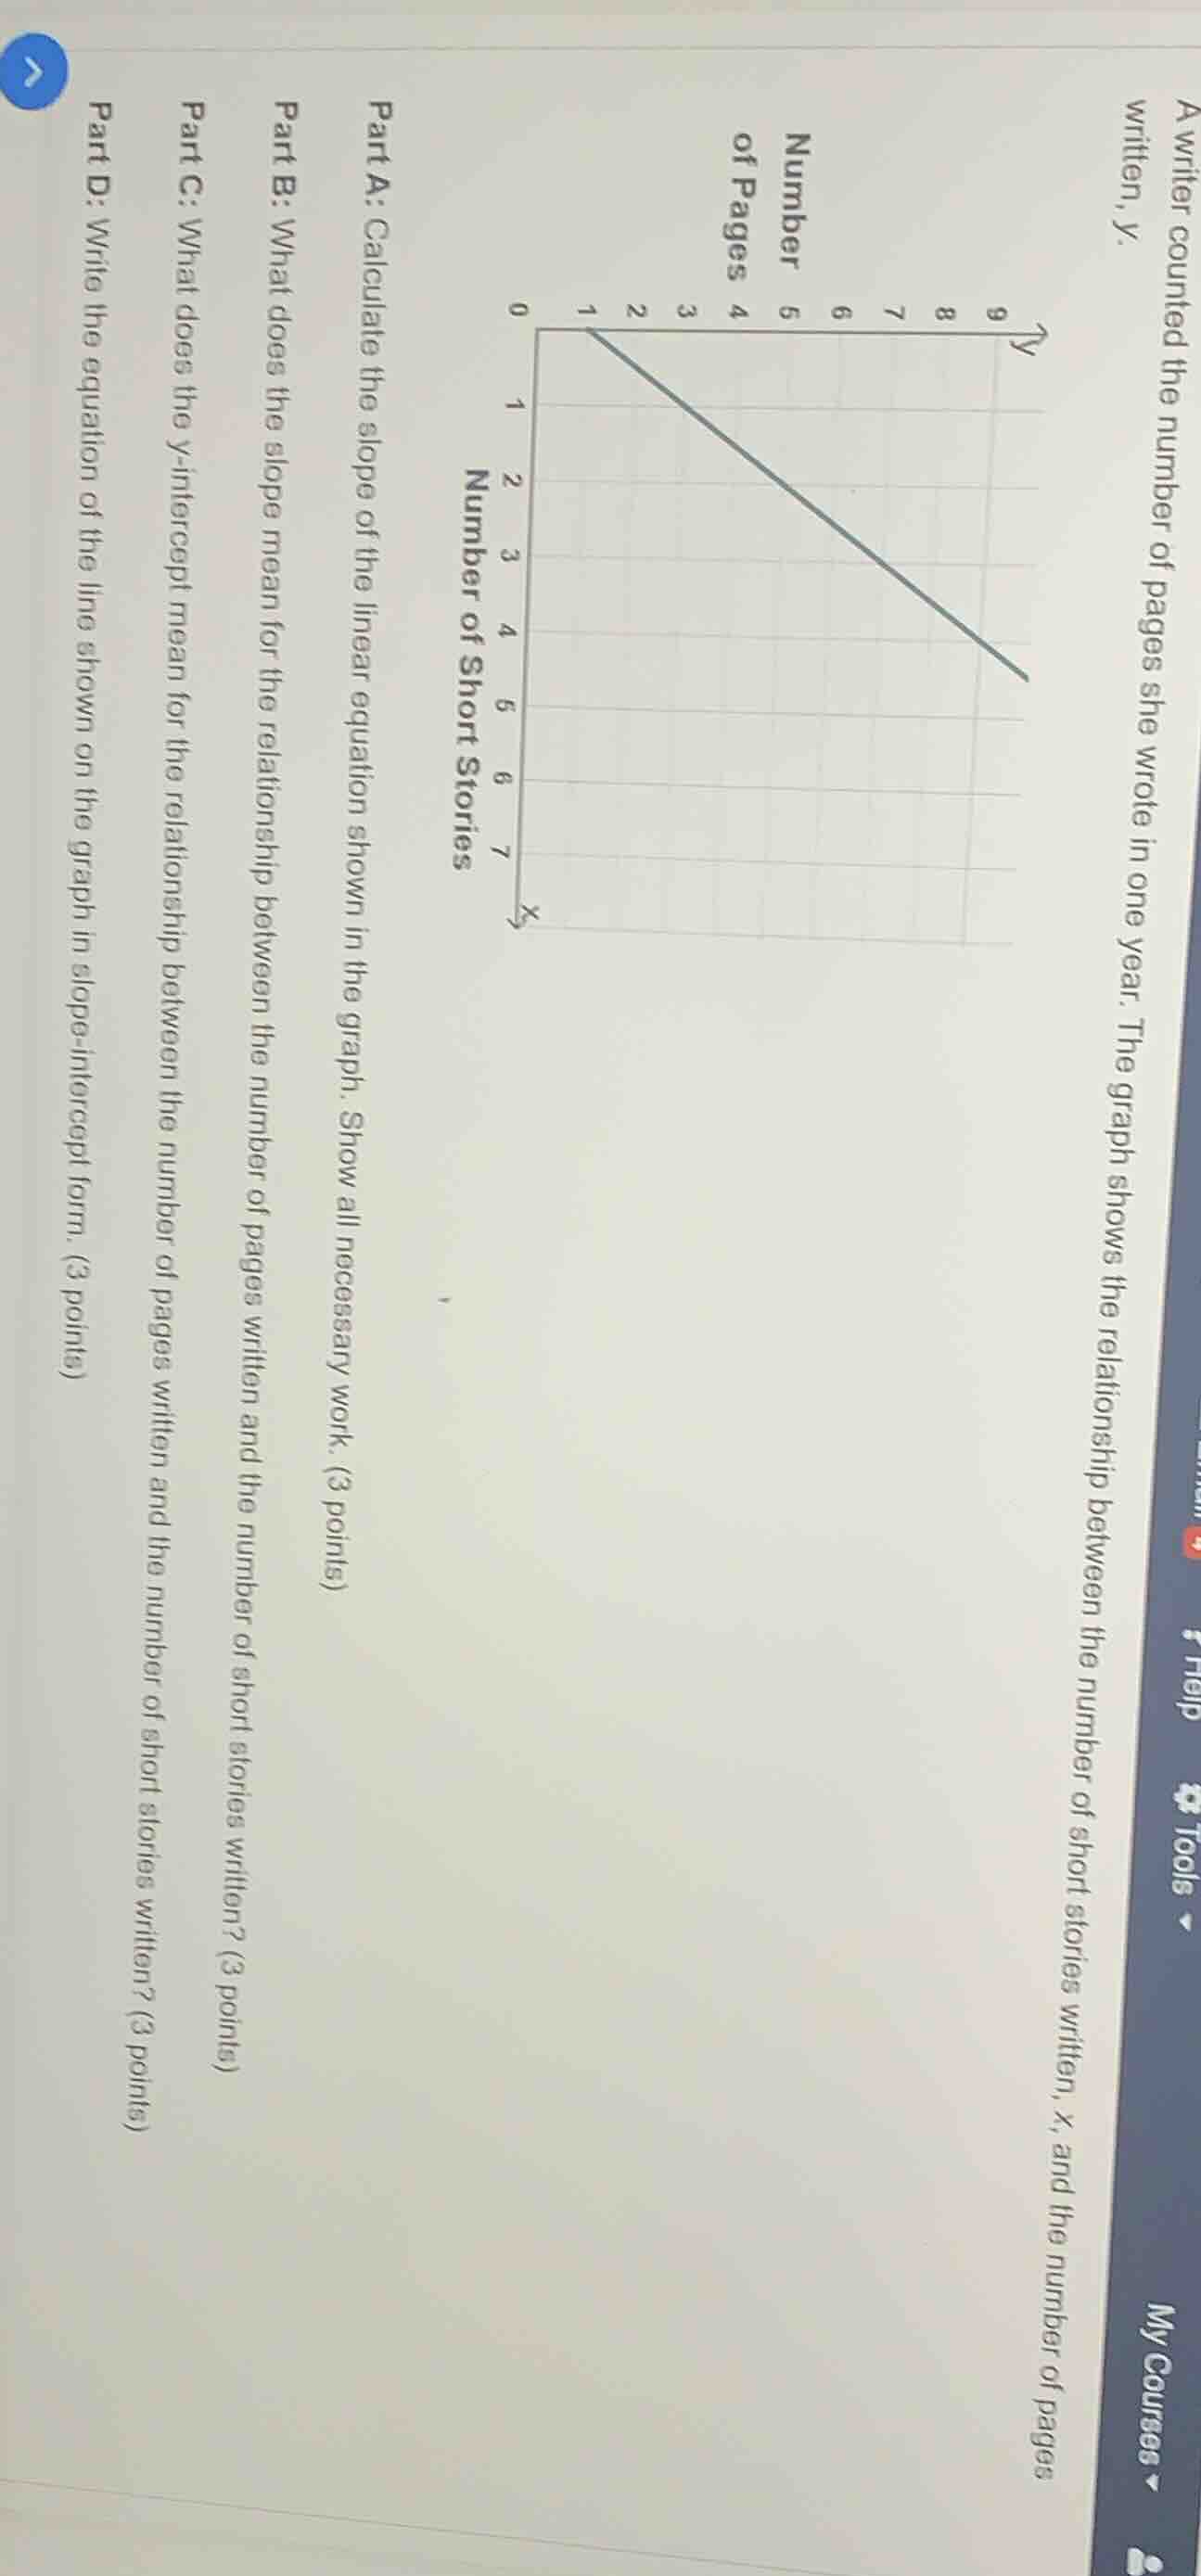
a writer counted the number of pages she wrote in one year. the graph shows the relationship between the number of short stories written, x, and the number of pages written, y.
part a: calculate the slope of the linear equation shown in the graph. show all necessary work. (3 points)
part b: what does the slope mean for the relationship between the number of pages written and the number of short stories written? (3 points)
part c: what does the y-intercept mean for the relationship between the number of pages written and the number of short stories written? (3 points)
part d: write the equation of the line shown on the graph in slope-intercept form. (3 points)
Step1: Identify two points on line
From the graph, we can take points $(x_1,y_1)=(0,1)$ and $(x_2,y_2)=(5,6)$.
Step2: Calculate the slope
Use slope formula $m=\frac{y_2-y_1}{x_2-x_1}$
$m=\frac{6-1}{5-0}=\frac{5}{5}=1$
Step3: Interpret the slope
The slope is the rate of change of pages per story.
Step4: Interpret the y-intercept
The y-intercept is the value of $y$ when $x=0$.
Step5: Write slope-intercept equation
Use $y=mx+b$, where $m=1$, $b=1$.
$y=1x+1$ or $y=x+1$

Snap & solve any problem in the app
Get step-by-step solutions on Sovi AI
Photo-based solutions with guided steps
Explore more problems and detailed explanations
Part A: The slope is 1.
Part B: For each additional short story written, the number of pages written increases by 1.
Part C: When 0 short stories are written, there is 1 page already written (e.g., a base page like a title page).
Part D: $y = x + 1$