QUESTION IMAGE
Question
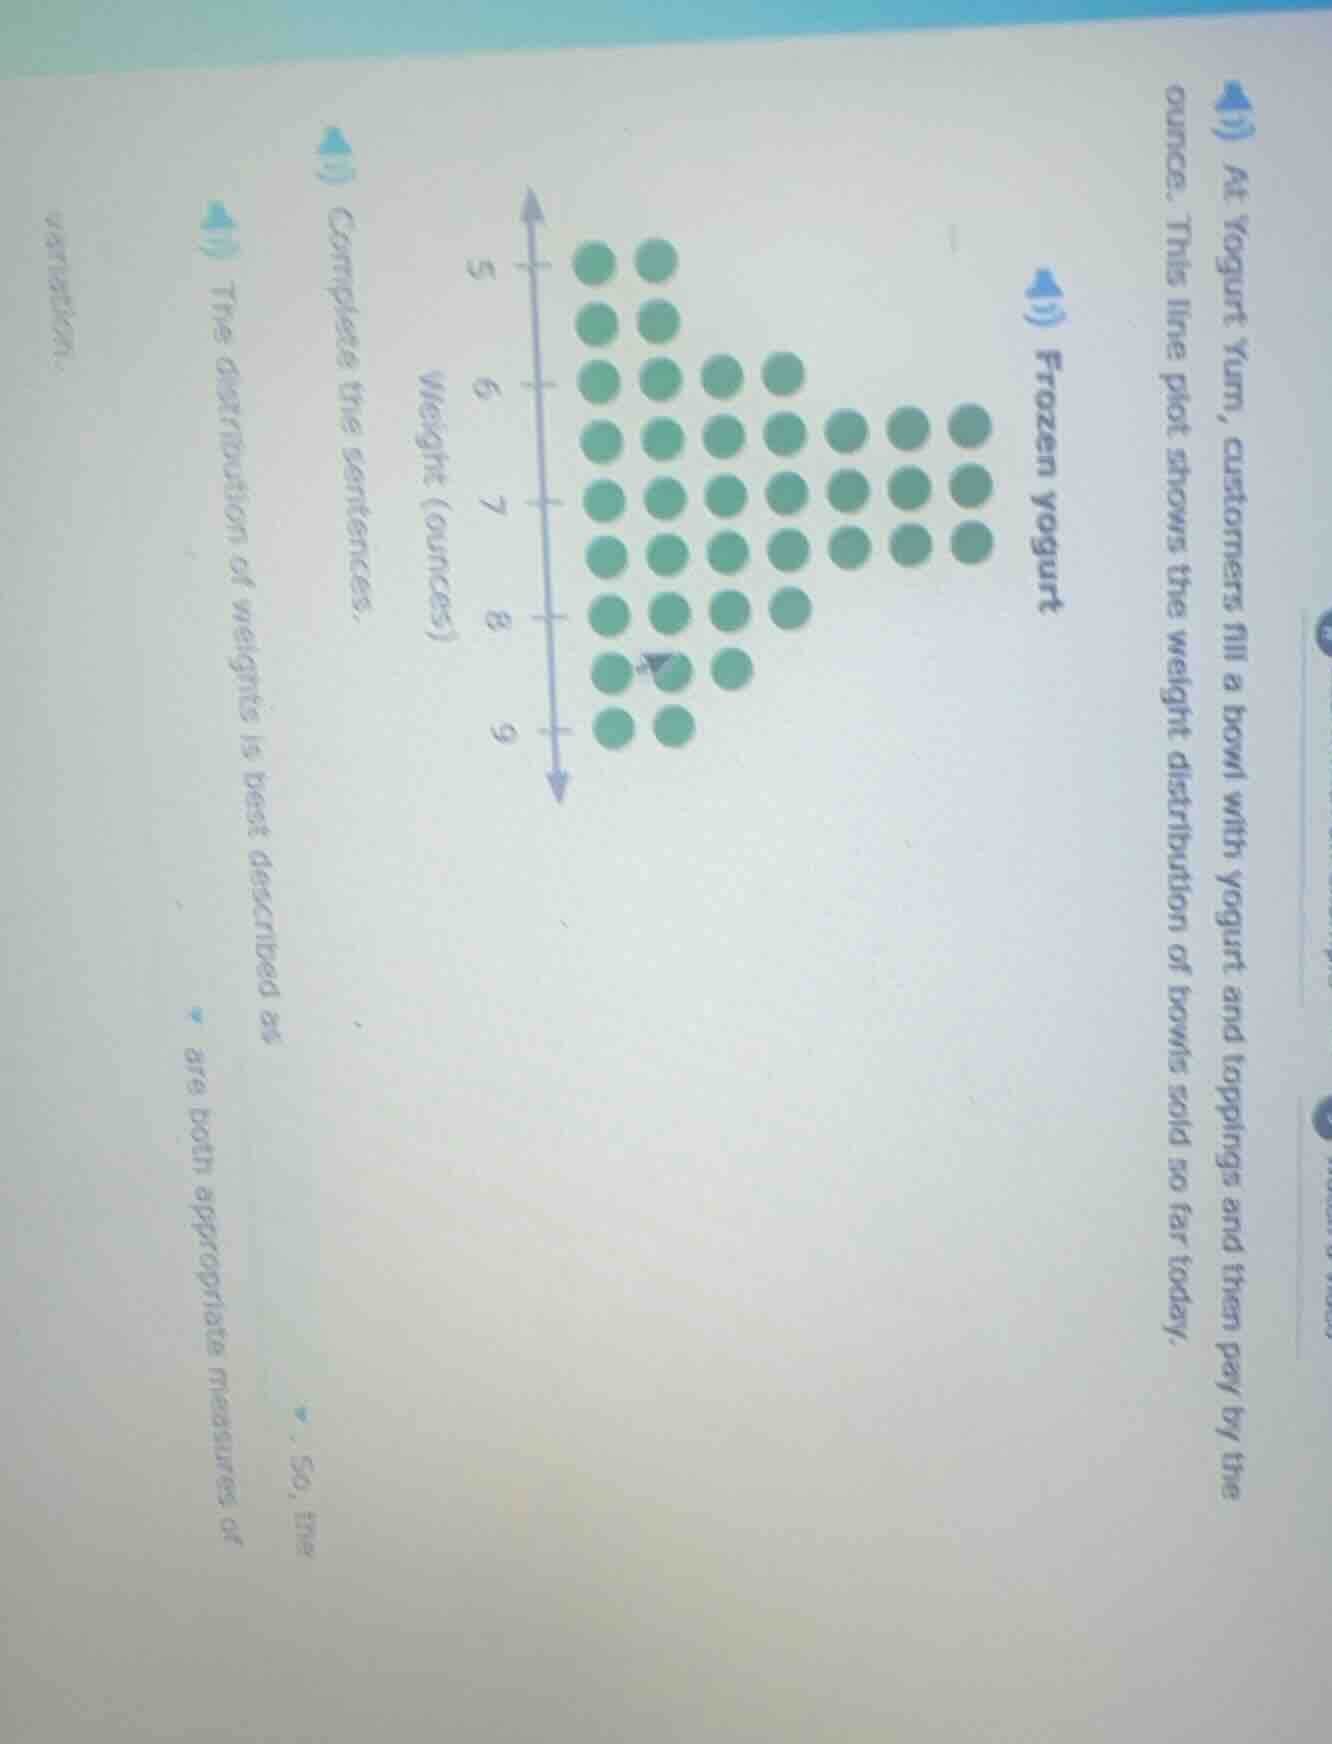
at yogurt yum, customers fill a bowl with yogurt and toppings and then pay by the ounce. this line plot shows the weight distribution of bowls sold so far today. frozen yogurt weight (ounces) complete the sentences. the distribution of weights is best described as are both appropriate measures of variation.
To solve this, we analyze the dot plot:
Step 1: Identify Distribution Shape
The dot plot (weights of yogurt bowls) has data that is symmetric around a central value (around 7 ounces). Most dots cluster in the middle, with tails tapering evenly on both the lower (5–6 oz) and upper (8–9 oz) ends. This matches a symmetric (or approximately normal) distribution.
Step 2: Appropriate Measures of Center/Spread
For symmetric distributions, the mean and median are close (since symmetry implies no skew), and the standard deviation (or interquartile range, IQR) are appropriate. The mean is pulled by outliers, but in symmetric data, there are no extreme outliers, so mean and median work.
- The distribution of weights is best described as symmetric (data is balanced around the center, with equal spread on both sides).
- For symmetric data, the mean and median are both appropriate measures of center (they will be similar), and the standard deviation (or IQR) for spread.

Snap & solve any problem in the app
Get step-by-step solutions on Sovi AI
Photo-based solutions with guided steps
Explore more problems and detailed explanations
- The distribution of weights is best described as \(\boldsymbol{\text{symmetric}}\).
- \(\boldsymbol{\text{Mean}}\) and \(\boldsymbol{\text{Median}}\) are both appropriate measures of center (or "Mean and Median" for spread-related context, adjusted to the exact question’s wording if needed).