QUESTION IMAGE
Question
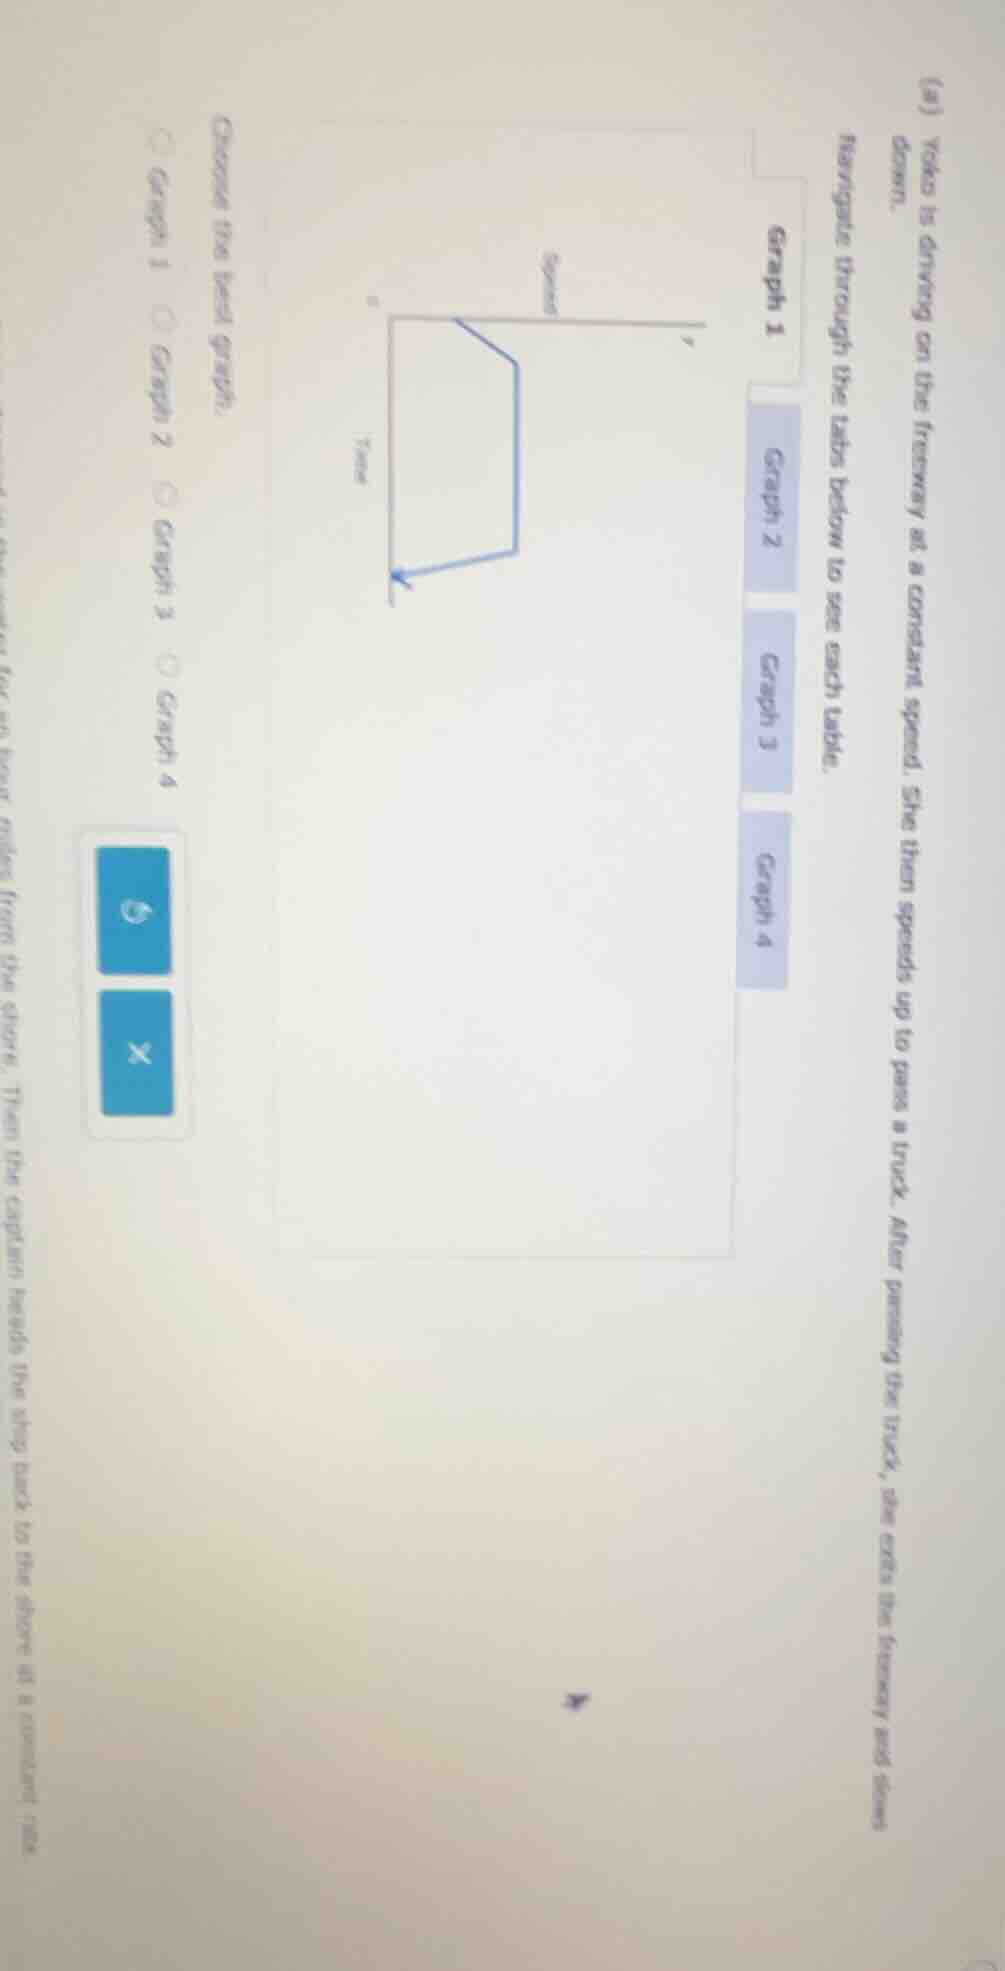
(a) yoko is driving on the freeway at a constant speed. she then speeds up to pass a truck. after passing the truck, she exits the freeway and slows down.
navigate through the tabs below to see each table.
graph 1
graph 2
graph 3
graph 4
choose the best graph:
graph 1 ○ graph 2 ○ graph 3 ○ graph 4
To solve this, we analyze Yoko's driving behavior:
- Constant speed initially: A constant speed means the graph (with speed on the y - axis and time on the x - axis) should be a horizontal line (since speed doesn't change with time).
- Speeds up to pass a truck: When speeding up, the speed (y - value) increases as time (x - value) increases, so the graph should have a positive - sloped line here.
- Slows down after passing the truck: When slowing down, the speed (y - value) decreases as time (x - value) increases, so the graph should have a negative - sloped line here.
- Stops at the end: Finally, the speed becomes 0 and stays 0, so the graph should end with a horizontal line at y = 0.
Looking at the description of Graph 1 (and comparing with the other graphs, though the other graphs are not fully visible, the key is to match the behavior: constant speed (horizontal), then increasing speed (positive slope), then decreasing speed (negative slope), then 0 speed (horizontal at 0)). So the correct graph should show these three phases (constant, increasing, decreasing, then 0) in sequence. Assuming Graph 1 (from the option) matches this behavior:

Snap & solve any problem in the app
Get step-by-step solutions on Sovi AI
Photo-based solutions with guided steps
Explore more problems and detailed explanations
Graph 1