QUESTION IMAGE
Question
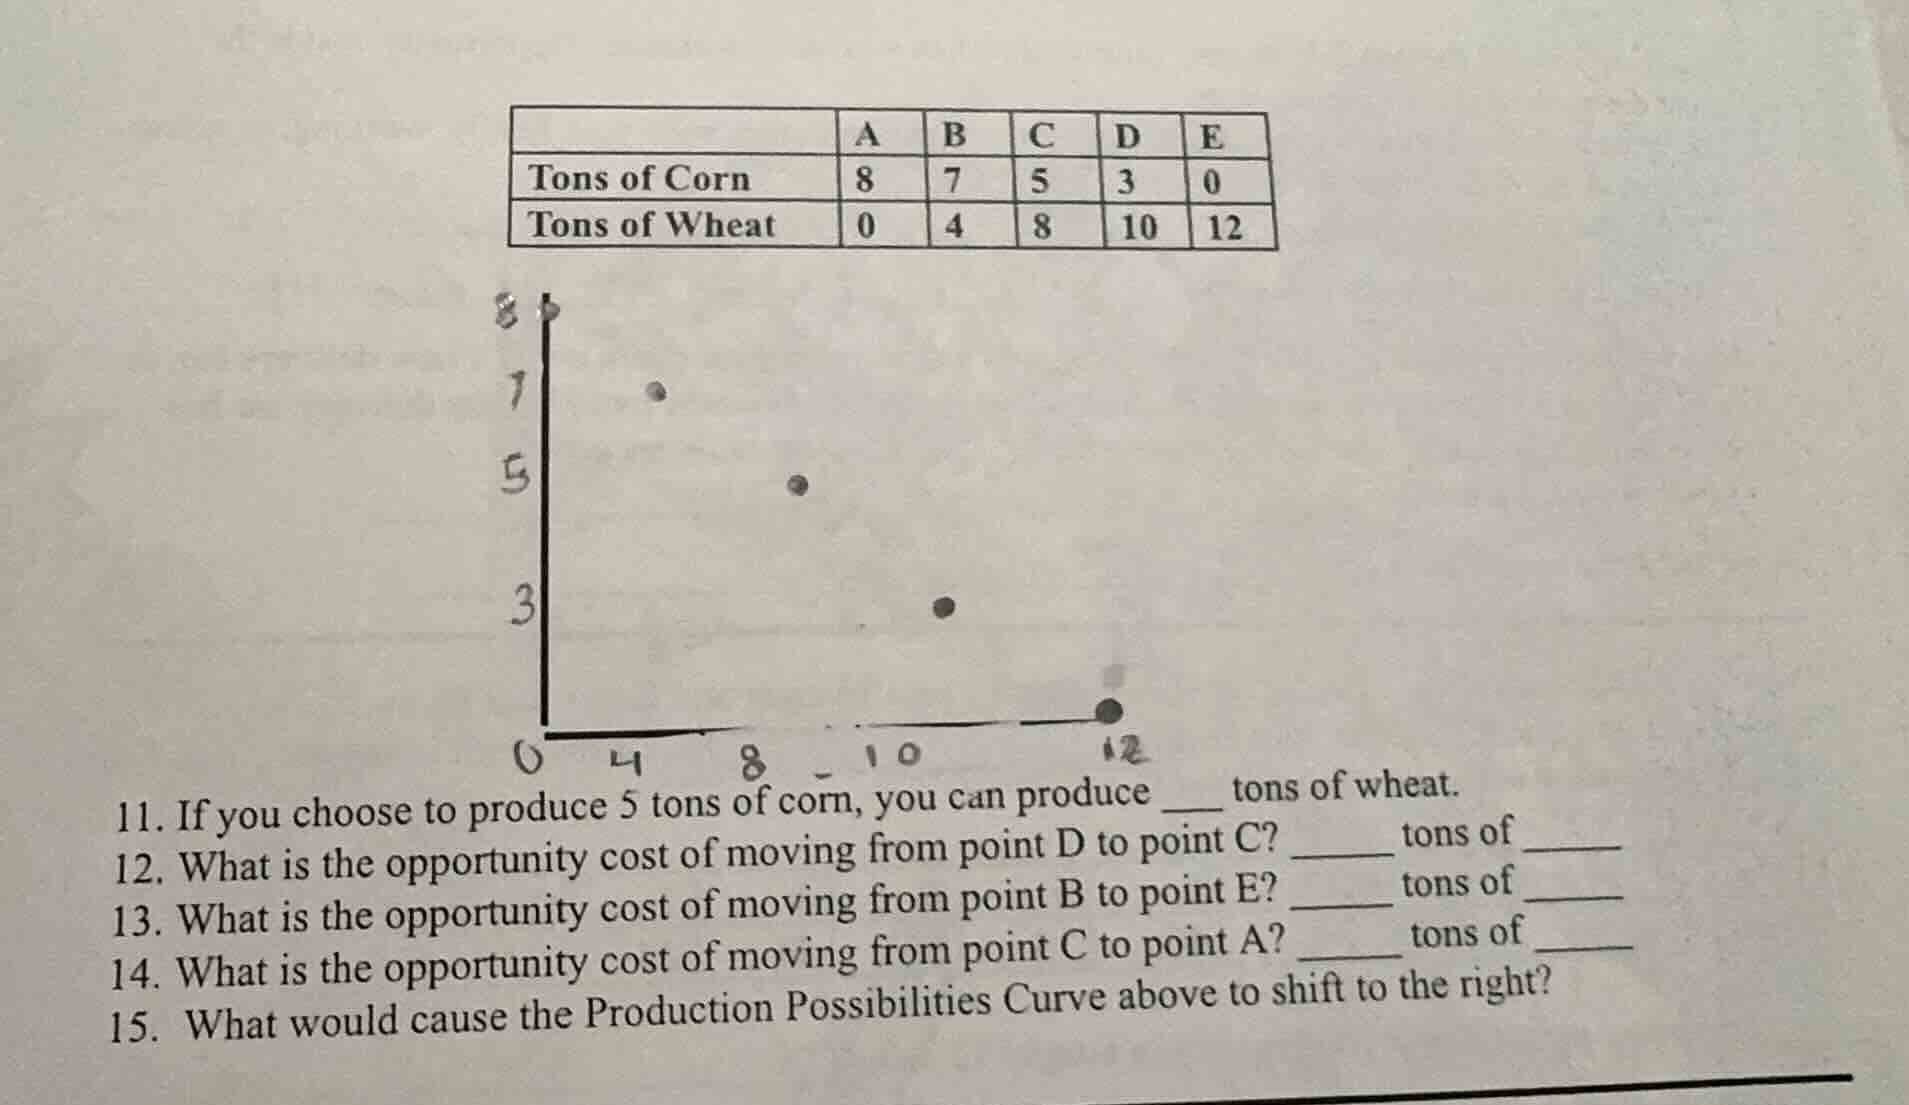
- if you choose to produce 5 tons of corn, you can produce _ tons of wheat. 12. what is the opportunity cost of moving from point d to point c? __ tons of __ 13. what is the opportunity cost of moving from point b to point e? __ tons of __ 14. what is the opportunity cost of moving from point c to point a? __ tons of ____ 15. what would cause the production possibilities curve above to shift to the right?
Step1: Match corn to wheat (Q11)
Locate 5 tons corn in the table, find corresponding wheat value.
From the table, 5 tons of corn (point C) pairs with 8 tons of wheat.
Step2: Calculate D to C opportunity cost (Q12)
Find change in corn and wheat.
Corn change: $5 - 3 = 2$ tons (gain), Wheat change: $8 - 10 = -2$ tons (loss). Opportunity cost is 2 tons of wheat.
Step3: Calculate B to E opportunity cost (Q13)
Find change in corn and wheat.
Corn change: $0 - 7 = -7$ tons (loss), Wheat change: $12 - 4 = 8$ tons (gain). Opportunity cost is 7 tons of corn.
Step4: Calculate C to A opportunity cost (Q14)
Find change in corn and wheat.
Corn change: $8 - 5 = 3$ tons (gain), Wheat change: $0 - 8 = -8$ tons (loss). Opportunity cost is 8 tons of wheat.
Step5: Identify PPC shift cause (Q15)
List factors that expand production capacity.
Examples: technological improvements, increase in resources (land, labor, capital), or improved worker productivity.

Snap & solve any problem in the app
Get step-by-step solutions on Sovi AI
Photo-based solutions with guided steps
Explore more problems and detailed explanations
- 8
- 2; wheat
- 7; corn
- 8; wheat
- Factors such as technological advancements in corn/wheat production, an increase in available farmland, a larger skilled agricultural workforce, or an increase in agricultural capital (like better farming equipment) would cause the Production Possibilities Curve to shift to the right.