QUESTION IMAGE
Question
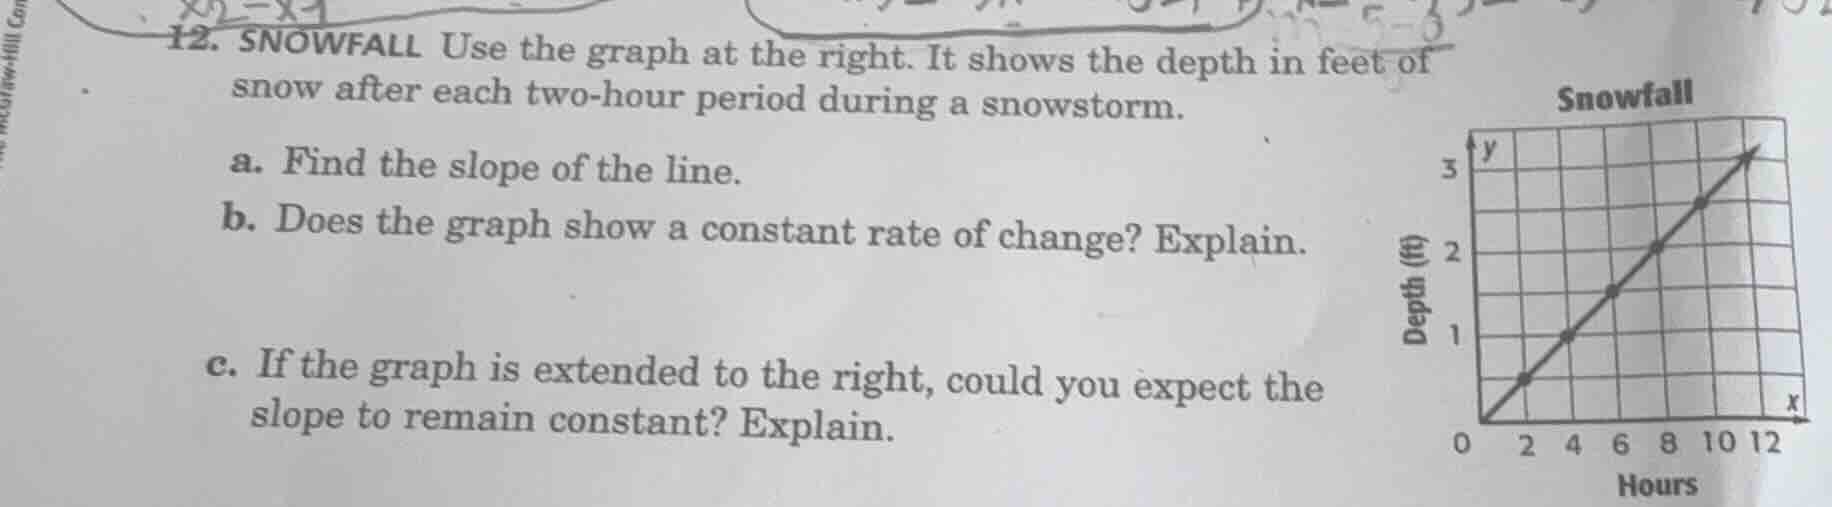
- snowfall use the graph at the right. it shows the depth in feet of snow after each two - hour period during a snowstorm.
a. find the slope of the line.
b. does the graph show a constant rate of change? explain.
c. if the graph is extended to the right, could you expect the slope to remain constant? explain.
Part (a)
Step1: Identify two points
From the graph, let's take two points. For example, when \( x = 2 \) (hours), \( y = 0.5 \) (feet) and when \( x = 4 \) (hours), \( y = 1 \) (feet). Or we can take \( (0,0) \) and \( (12, 3) \) as another pair. Let's use \( (0,0) \) and \( (12, 3) \).
Step2: Use slope formula
The slope \( m \) of a line passing through two points \( (x_1,y_1) \) and \( (x_2,y_2) \) is given by \( m=\frac{y_2 - y_1}{x_2 - x_1} \).
Substituting \( (x_1,y_1)=(0,0) \) and \( (x_2,y_2)=(12,3) \), we get \( m=\frac{3 - 0}{12 - 0}=\frac{3}{12}=\frac{1}{4} \).
A constant rate of change is indicated by a straight - line graph (linear graph) because the slope (which represents the rate of change) of a straight line is constant. Since the graph of snowfall depth vs. time is a straight line, the slope (rate of change of snow depth with respect to time) will be the same between any two points on the line. For example, if we calculate the slope between \( (2, 0.5) \) and \( (4,1) \), we have \( m=\frac{1 - 0.5}{4 - 2}=\frac{0.5}{2}=\frac{1}{4} \), which is the same as the slope we calculated earlier. So, the graph shows a constant rate of change because it is a straight line, and the slope (rate of change) is constant for a straight line.
If the snowstorm continues with the same pattern (i.e., the rate of snowfall does not change), then the relationship between the number of hours and the snow depth will remain linear. A linear relationship has a constant slope. In the context of a snowstorm, if the conditions (like the intensity of the snowfall) remain the same, we can expect the rate of snow accumulation (which is represented by the slope) to remain constant. So, if the graph is extended to the right (assuming the snowstorm continues with the same snowfall rate), the slope should remain constant.

Snap & solve any problem in the app
Get step-by-step solutions on Sovi AI
Photo-based solutions with guided steps
Explore more problems and detailed explanations
The slope of the line is \(\frac{1}{4}\) (or 0.25).