QUESTION IMAGE
Question
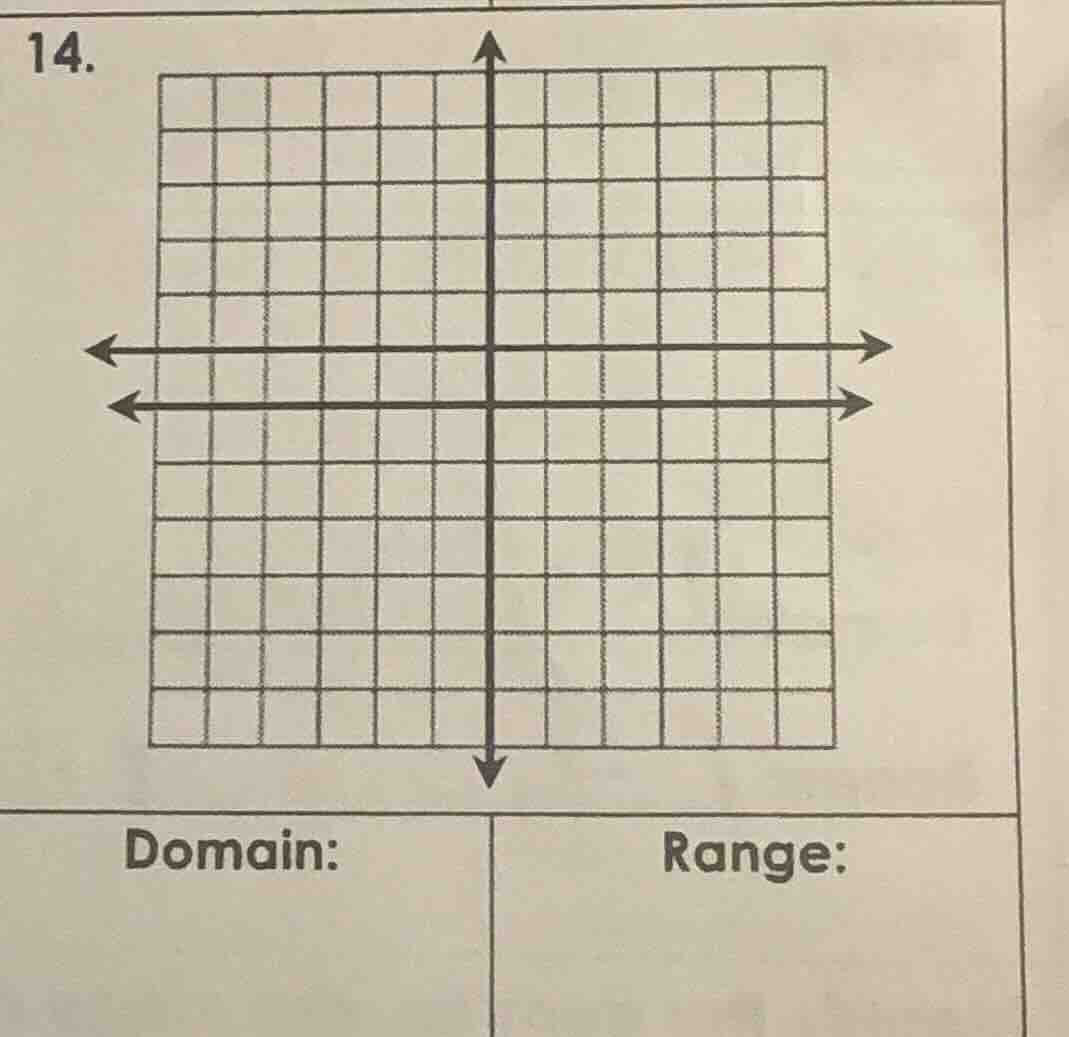
14.
domain:
range:
Step1: Analyze the graph
The graph shows two horizontal lines. Let's assume the equations of the lines. The upper horizontal line and the lower horizontal line—wait, actually, looking at the grid, if we consider the horizontal lines, let's find their equations. Wait, maybe the lines are \( y = 1 \) and \( y=- 1 \)? No, wait, the two horizontal lines: let's check the y - coordinates. Wait, actually, the two horizontal lines—wait, maybe it's two horizontal lines, say \( y = k_1 \) and \( y=k_2 \)? Wait, no, maybe the graph is of two horizontal lines, like \( y = 1 \) and \( y=-1 \)? Wait, no, looking at the grid, the two horizontal lines: let's see the vertical axis (y - axis) and horizontal axis (x - axis). The horizontal lines are parallel to the x - axis, so their equations are of the form \( y = c \), where \( c \) is a constant.
Wait, maybe the two lines are \( y = 1 \) and \( y=-1 \)? No, wait, the distance between the two horizontal lines: looking at the grid, each square is a unit? Let's assume the grid has unit squares. Then the two horizontal lines: one is at \( y = 1 \) and the other at \( y=-1 \)? No, wait, the middle of the two horizontal lines is the x - axis? Wait, no, the two horizontal lines are parallel, so they are horizontal lines (constant y - value).
For a horizontal line \( y = c \), the domain is all real numbers (since x can be any real number, as the line extends infinitely left and right), and the range is just the single value \( c \) (since y is always \( c \), no matter what x is).
Wait, the graph has two horizontal lines. Let's say the upper horizontal line is \( y = 1 \) and the lower one is \( y=-1 \)? No, wait, maybe the two lines are \( y = 1 \) and \( y = - 1 \)? Wait, no, looking at the grid, the two horizontal lines: let's check the y - coordinates. Wait, maybe the two lines are \( y = 1 \) and \( y=-1 \), but actually, maybe it's a typo, and it's two horizontal lines, say \( y = 1 \) and \( y=-1 \), but no, maybe the two lines are the same? No, the graph shows two distinct horizontal lines. Wait, maybe the lines are \( y = 1 \) and \( y=-1 \), but actually, let's re - examine.
Wait, the standard way: for a horizontal line \( y = k \), domain is \( (-\infty,\infty) \) (all real numbers) and range is \( \{k\} \) (just the number k).
So if there are two horizontal lines, say \( y = 1 \) and \( y=-1 \), then for each line:
For the line \( y = 1 \):
- Domain: All real numbers (because the line extends infinitely in the x - direction, so x can be any real number)
- Range: \( \{1\} \) (because y is always 1, regardless of x)
For the line \( y=-1 \):
- Domain: All real numbers (x can be any real number)
- Range: \( \{-1\} \) (y is always - 1)
But maybe the two lines are, for example, \( y = 1 \) and \( y=-1 \), but the problem is to find the domain and range of the graph (the two lines together? Wait, no, maybe it's a single line? Wait, the graph shows two horizontal lines, maybe it's a mistake, and it's one line? Wait, no, the original graph: looking at the image, there are two horizontal lines, both parallel to the x - axis, so they are two horizontal lines.
Wait, maybe the lines are \( y = 1 \) and \( y=-1 \), but let's assume that the two lines are \( y = 1 \) and \( y=-1 \). Then:
For the domain of each line: since horizontal lines extend infinitely left and right, x can be any real number, so domain is all real numbers, \( (-\infty,\infty) \) or \( \mathbb{R} \).
For the range: each line has a constant y - value. So if the upper line is \( y = 1 \), its range is \( \{1\} \), and the lo…

Snap & solve any problem in the app
Get step-by-step solutions on Sovi AI
Photo-based solutions with guided steps
Explore more problems and detailed explanations
Domain: \( (-\infty,\infty) \) (or all real numbers)
Range: \( \{-1,1\} \) (assuming the two horizontal lines are at \( y = 1 \) and \( y=-1 \); if it's a single horizontal line at \( y = k \), range is \( \{k\} \) and domain is \( (-\infty,\infty) \))
Wait, maybe the two lines are the same? No, the graph shows two distinct lines. Alternatively, maybe the lines are \( y = 1 \) and \( y=-1 \), so the domain is all real numbers and the range is \( \{-1,1\} \).