QUESTION IMAGE
Question
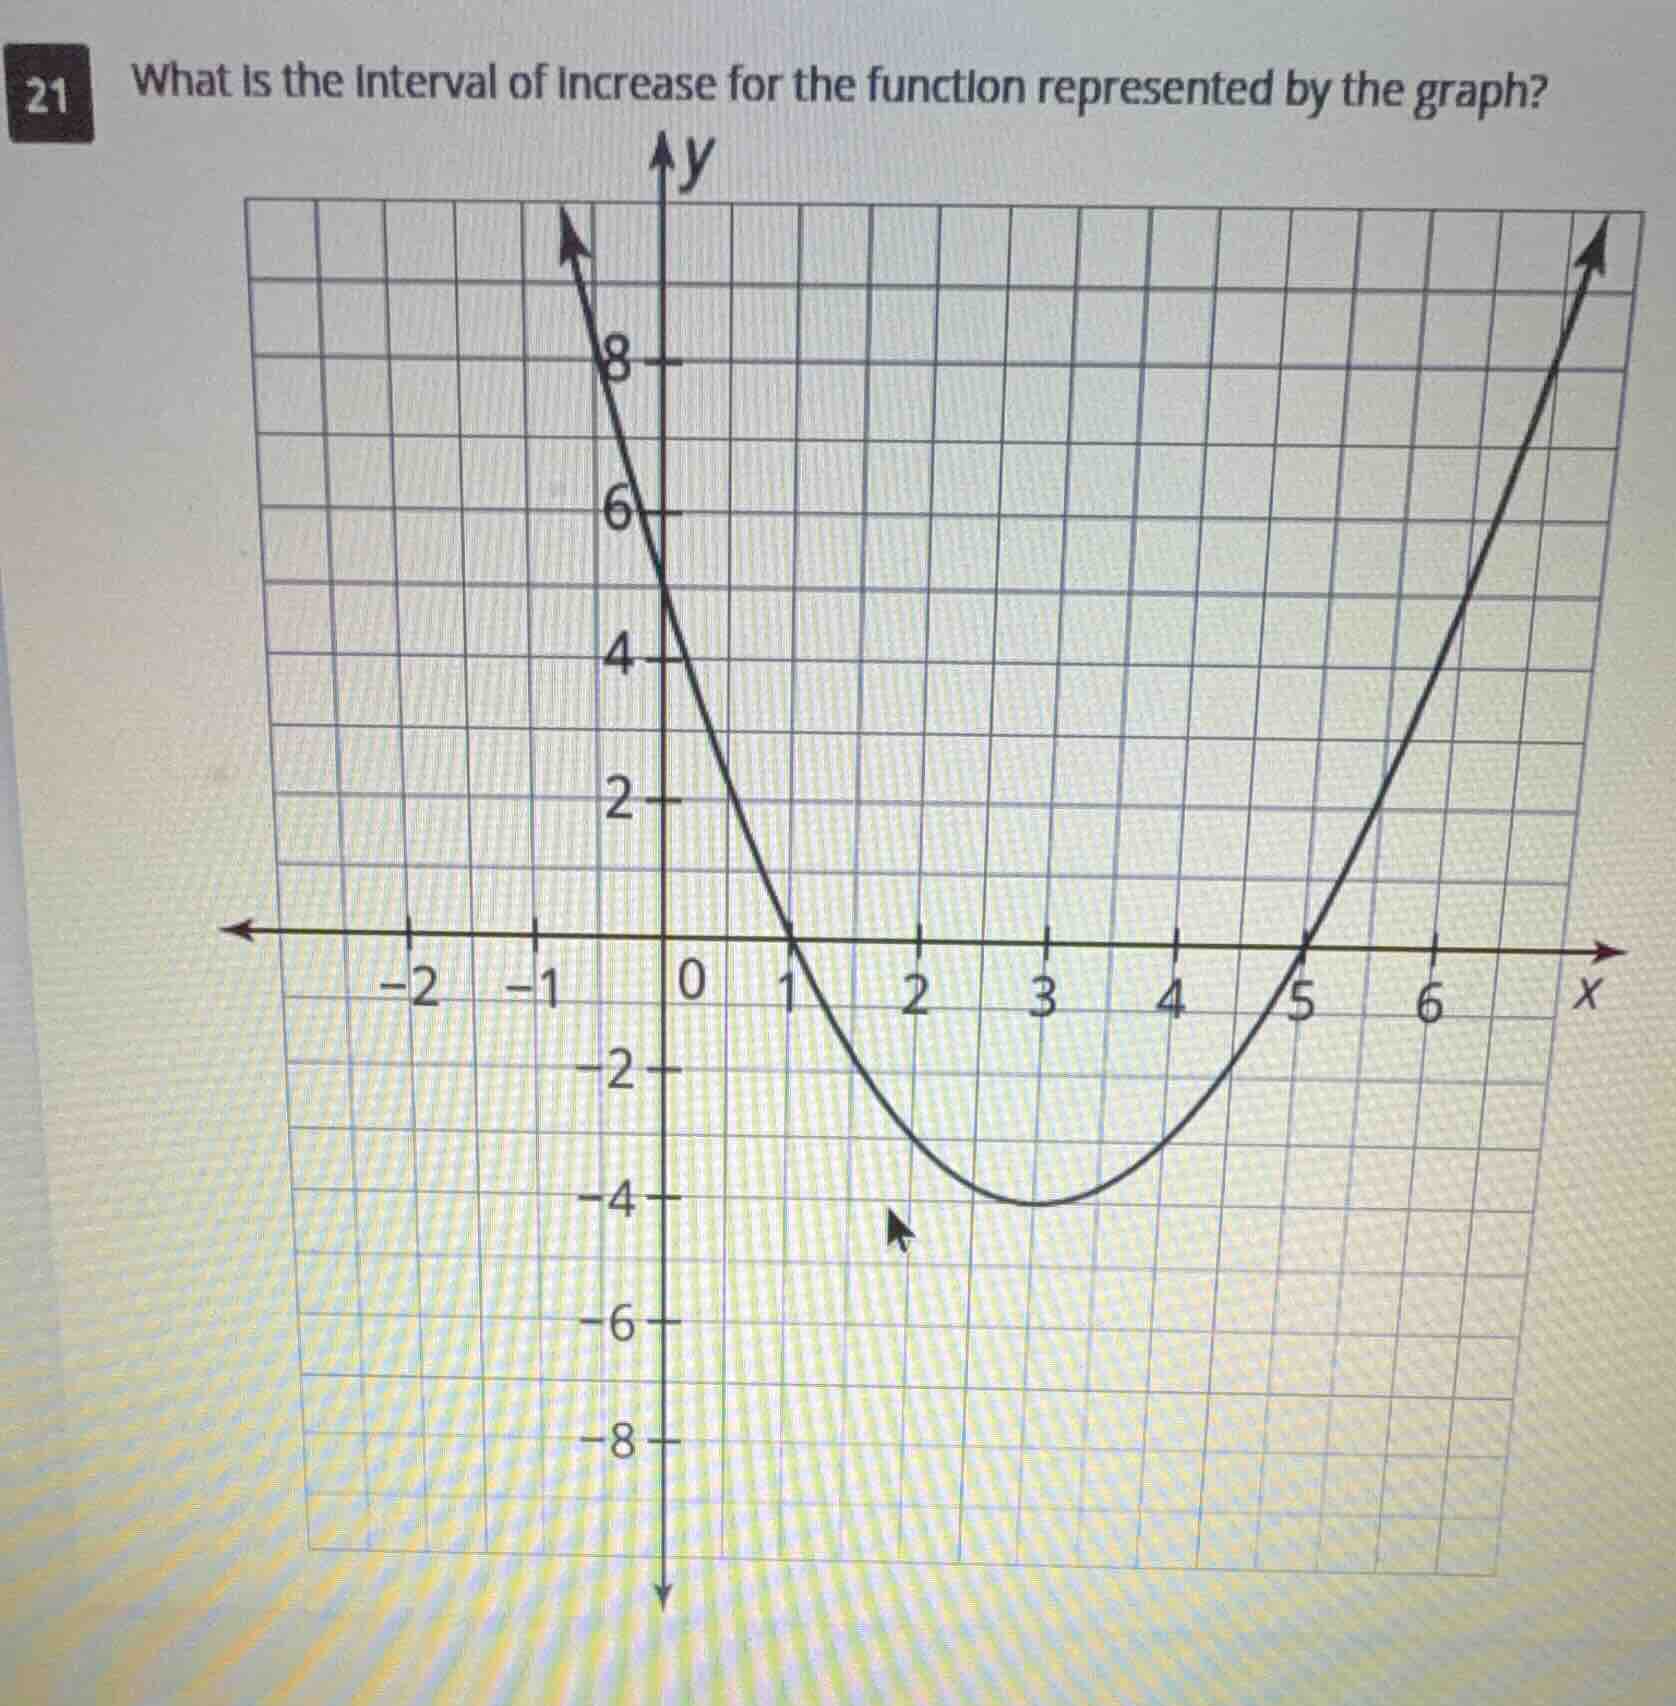
21 what is the interval of increase for the function represented by the graph?
Step1: Identify the vertex
The graph is a parabola with vertex at $x=3$.
Step2: Determine increasing interval
For a right-opening upward parabola, the function increases when $x$ is greater than the vertex's $x$-value. So the interval is $x > 3$, or in interval notation $(3, \infty)$.

Snap & solve any problem in the app
Get step-by-step solutions on Sovi AI
Photo-based solutions with guided steps
Explore more problems and detailed explanations
The interval of increase is $(3, \infty)$ (or $x > 3$)