QUESTION IMAGE
Question
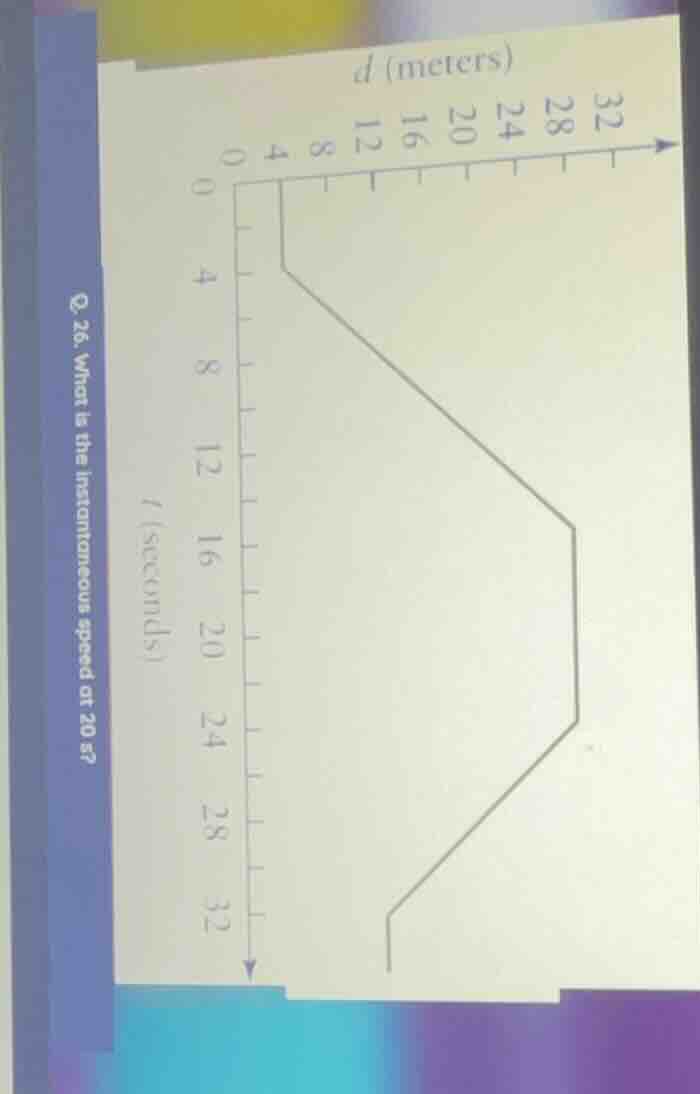
q. 26. what is the instantaneous speed at 20 s?
(the chart is a graph with t (seconds) on the vertical axis and d (meters) on the horizontal axis, showing a polygonal line representing distance - time relationship.)
Step1: Understand the graph type
The graph is a distance - time graph. In a distance - time graph, the slope of the line segment represents the speed (since speed $v=\frac{\Delta d}{\Delta t}$, where $\Delta d$ is the change in distance and $\Delta t$ is the change in time). At $t = 20$ s, we need to check which segment of the graph $t = 20$ s lies in.
Looking at the graph, we can see the intervals of time:
- From $t = 0$ to $t = 4$ s: The distance is constant (horizontal line), so speed is 0.
- From $t = 4$ s to $t = 16$ s (approximate, but we focus on $t = 20$ s): Wait, actually, let's look at the flat parts and the sloped parts. Wait, the time axis is from 0 to 32 seconds (vertical axis is time $t$ in seconds, horizontal axis is distance $d$ in meters? Wait, no, wait: Wait, the vertical axis is $t$ (seconds) and horizontal axis is $d$ (meters)? Wait, that's an unusual graph, but speed is $\frac{\Delta d}{\Delta t}$, so if the graph is $d$ (horizontal) vs $t$ (vertical), then the slope would be $\frac{\Delta d}{\Delta t}$, but actually, in standard distance - time graphs, $t$ is on the horizontal axis and $d$ on the vertical. Wait, maybe there is a mis - labeling. Wait, the problem says "instantaneous speed at 20 s". Let's re - interpret: Let's assume that the horizontal axis is time $t$ (seconds) and vertical axis is distance $d$ (meters). Wait, no, the labels are: $d$ (meters) on the horizontal (x - axis) and $t$ (seconds) on the vertical (y - axis). So the graph is a plot of $t$ (y) vs $d$ (x). Then, speed $v=\frac{\Delta d}{\Delta t}$, so the reciprocal of the slope of the line (since slope $m=\frac{\Delta t}{\Delta d}$, so $v=\frac{1}{m}=\frac{\Delta d}{\Delta t}$).
Looking at the graph, at $t = 20$ s, we need to see the segment of the graph. Let's find the time interval where $t = 20$ s lies. Let's look at the horizontal (distance) and vertical (time) axes.
Wait, maybe a better way: Let's find two points on the segment that includes $t = 20$ s. Let's assume that from $t = 16$ s to $t = 24$ s (approximate), the graph is a horizontal line? No, wait, the graph has different segments. Wait, looking at the graph, when $t$ is between, say, 16 s and 24 s, the distance $d$ is constant? No, that would mean speed is 0. Wait, no, if $t$ is on the vertical axis and $d$ on the horizontal, then a horizontal line in $t - d$ graph would mean that as $d$ changes, $t$ is constant, which doesn't make sense. Wait, I think there is a mis - labeling. Let's assume that the correct graph is $d$ (vertical) vs $t$ (horizontal), so $t$ (x - axis: 0 - 32 s) and $d$ (y - axis: 0 - 32 m). Then, the graph is a piece - wise linear graph.
Let's re - analyze: Let's assume the x - axis is $t$ (seconds) and y - axis is $d$ (meters). Then, to find the instantaneous speed at $t = 20$ s, we need to find the slope of the tangent at $t = 20$ s. Since the graph is piece - wise linear, the instantaneous speed at a point on a linear segment is the slope of that segment.
Looking at the graph, let's find the segment that contains $t = 20$ s. Let's see the time intervals:
- From $t = 0$ to $t = 4$ s: $d$ is constant (horizontal line), so speed $v = 0$.
- From $t = 4$ s to $t = 16$ s: Let's say the line goes from $(t_1,d_1)=(4,4)$ to $(t_2,d_2)=(16,24)$? Wait, no, this is getting confusing. Wait, the problem is about instantaneous speed, which in a distance - time graph (with $t$ on x - axis and $d$ on y - axis) is the slope of the graph at that point.
Wait, maybe the graph is a distance - time graph where:
- From $t = 0$ to $t = 4$ s: $d$ is constant (speed = 0…

Snap & solve any problem in the app
Get step-by-step solutions on Sovi AI
Photo-based solutions with guided steps
Explore more problems and detailed explanations
0 meters per second