QUESTION IMAGE
Question
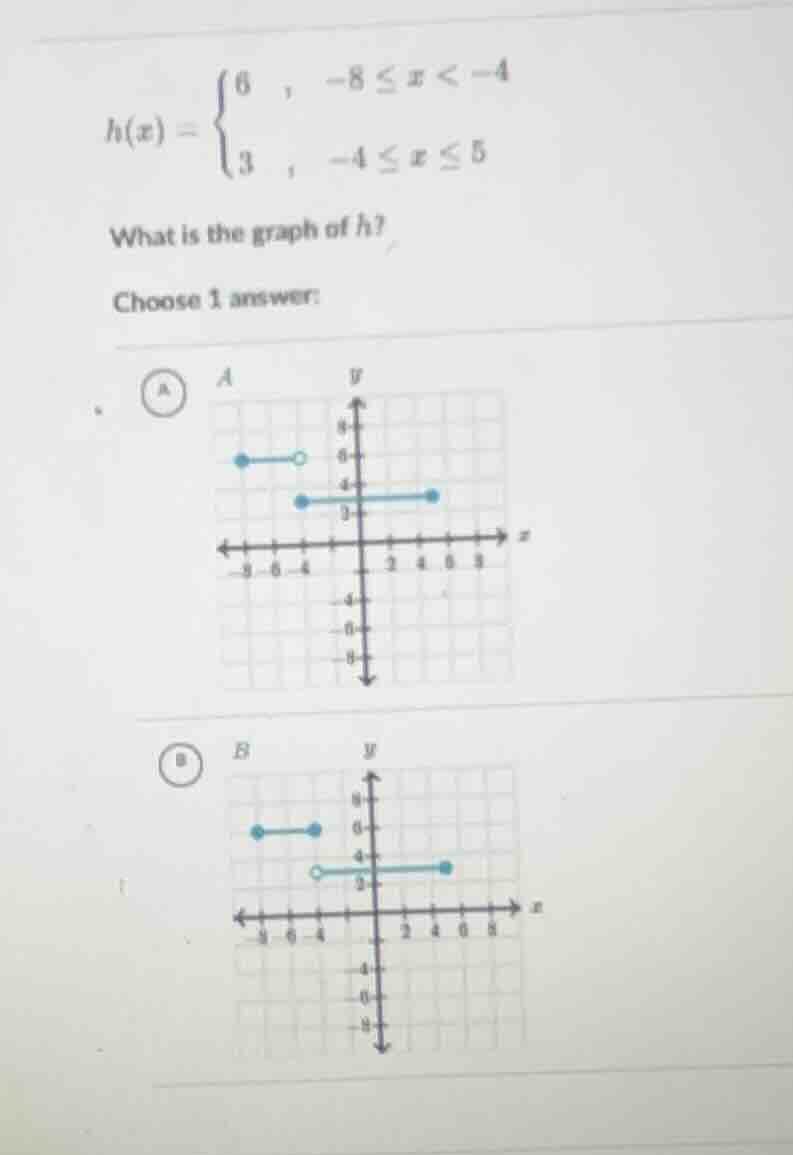
h(x) = \
what is the graph of h?
choose 1 answer:
a
\
b
\
Step1: Analyze the first piece of the function
The first piece of the piecewise function is \( h(x) = 6 \) for \( -8 \leq x < -4 \). This means when \( x \) is in the interval from \( -8 \) (inclusive) to \( -4 \) (exclusive), the \( y \)-value is 6. So, at \( x = -8 \), there should be a closed dot (since \( -8 \) is included), and at \( x = -4 \), there should be an open dot (since \( -4 \) is not included) with \( y = 6 \).
Step2: Analyze the second piece of the function
The second piece of the piecewise function is \( h(x) = 3 \) for \( -4 \leq x \leq 5 \). This means when \( x \) is in the interval from \( -4 \) (inclusive) to \( 5 \) (inclusive), the \( y \)-value is 3. So, at \( x = -4 \), there should be a closed dot (since \( -4 \) is included), and at \( x = 5 \), there should be a closed dot (since \( 5 \) is included) with \( y = 3 \).
Step3: Compare with the given graphs
- For option A: The first segment (for \( -8 \leq x < -4 \)) has a closed dot at \( x = -8 \) and an open dot at \( x = -4 \) with \( y = 6 \). The second segment (for \( -4 \leq x \leq 5 \)) has a closed dot at \( x = -4 \) and a closed dot at \( x = 5 \) with \( y = 3 \). This matches our analysis.
- For option B: The first segment has a closed dot at \( x = -4 \) (which is incorrect as \( x = -4 \) is not included in the first interval) and the second segment has an open dot at \( x = -4 \) (which is incorrect as \( x = -4 \) is included in the second interval). So, option B is incorrect.

Snap & solve any problem in the app
Get step-by-step solutions on Sovi AI
Photo-based solutions with guided steps
Explore more problems and detailed explanations
A