QUESTION IMAGE
Question
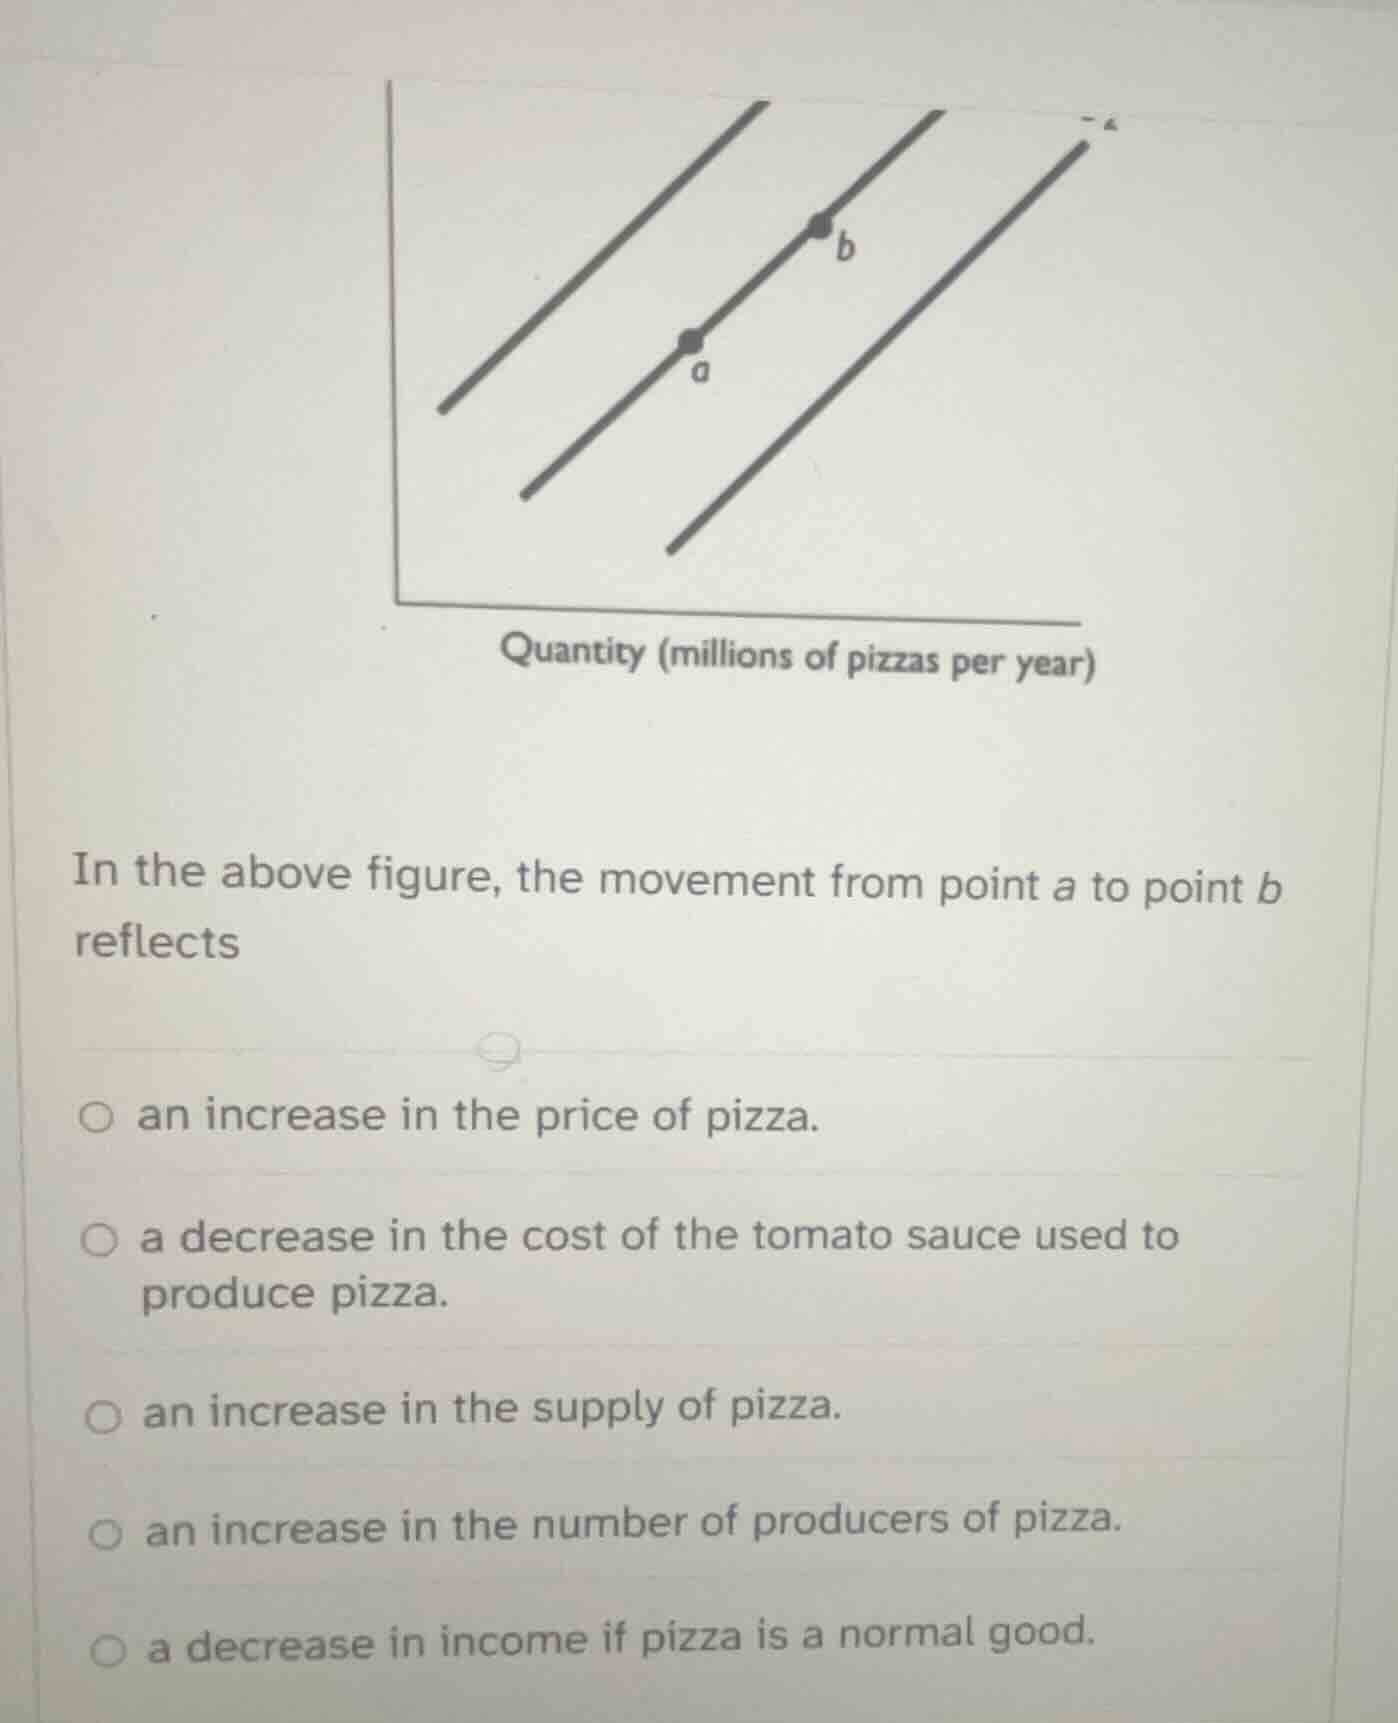
in the above figure, the movement from point a to point b reflects
an increase in the price of pizza.
a decrease in the cost of the tomato sauce used to produce pizza.
an increase in the supply of pizza.
an increase in the number of producers of pizza.
a decrease in income if pizza is a normal good.
Brief Explanations
- A movement along the same supply curve (from a to b) is caused by a change in the good's own price, not non-price factors. Non-price factors (like input costs, number of producers) shift the entire supply curve, while income affects demand, not supply directly. The movement from a to b shows higher quantity supplied at a higher price, which matches an increase in pizza's price.

Snap & solve any problem in the app
Get step-by-step solutions on Sovi AI
Photo-based solutions with guided steps
Explore more problems and detailed explanations
an increase in the price of pizza.