QUESTION IMAGE
Question
were added for this assignment.
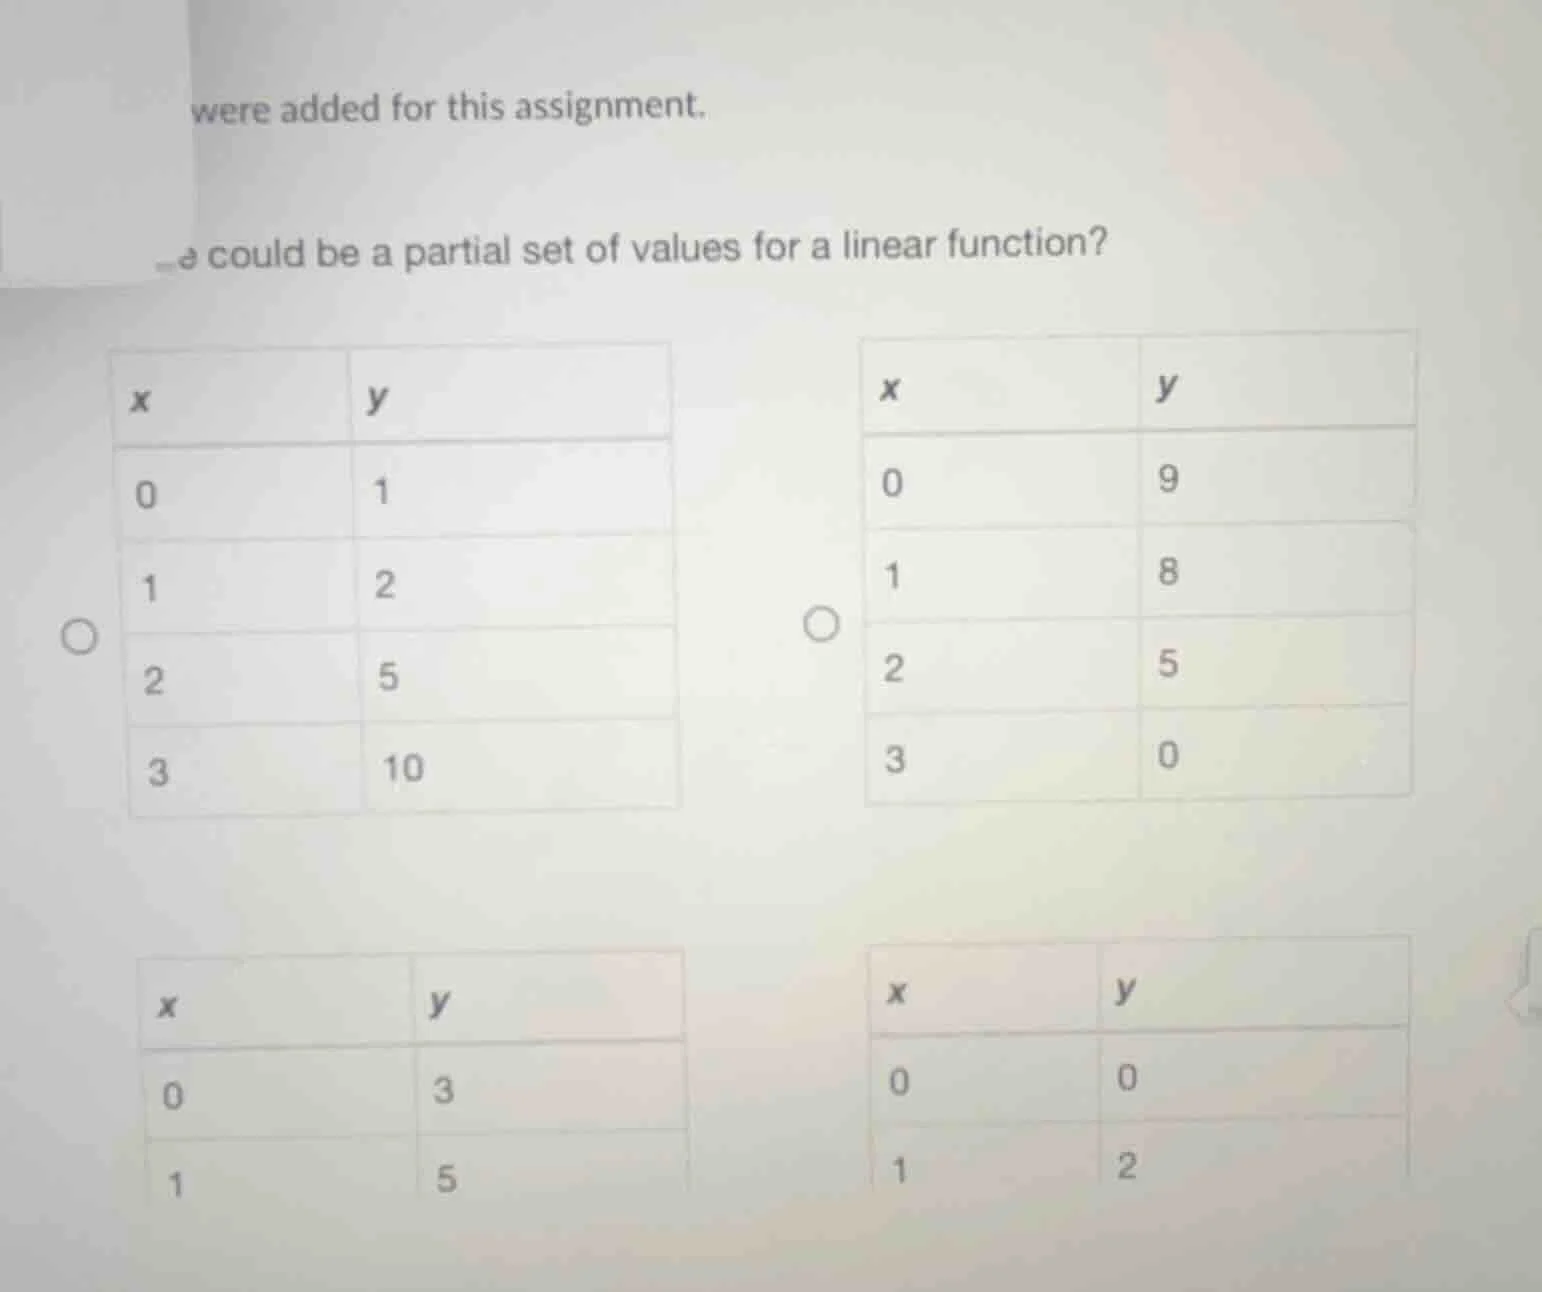
a could be a partial set of values for a linear function?
| x | y |
|---|---|
| 1 | 2 |
| 2 | 5 |
| 3 | 10 |
| x | y |
|---|---|
| 1 | 8 |
| 2 | 5 |
| 3 | 0 |
| x | y |
|---|---|
| 1 | 5 |
| x | y |
|---|---|
| 1 | 2 |
To determine which table represents a linear function, we check if the rate of change (slope) between consecutive points is constant. The slope \( m \) between two points \((x_1, y_1)\) and \((x_2, y_2)\) is calculated as \( m = \frac{y_2 - y_1}{x_2 - x_1} \).
Analyzing the First Table (Top - Left):
Points: \((0, 1)\), \((1, 2)\), \((2, 5)\), \((3, 10)\)
- Slope between \((0, 1)\) and \((1, 2)\): \( \frac{2 - 1}{1 - 0} = 1 \)
- Slope between \((1, 2)\) and \((2, 5)\): \( \frac{5 - 2}{2 - 1} = 3 \)
- Slopes are not constant (\(1
eq 3\)), so this is not linear.
Analyzing the Second Table (Top - Right):
Points: \((0, 9)\), \((1, 8)\), \((2, 5)\), \((3, 0)\)
- Slope between \((0, 9)\) and \((1, 8)\): \( \frac{8 - 9}{1 - 0} = -1 \)
- Slope between \((1, 8)\) and \((2, 5)\): \( \frac{5 - 8}{2 - 1} = -3 \)
- Slopes are not constant (\(-1
eq -3\)), so this is not linear.
Analyzing the Third Table (Bottom - Left):
Points: \((0, 3)\), \((1, 5)\) (only two points shown, but we can check the slope).
- Slope between \((0, 3)\) and \((1, 5)\): \( \frac{5 - 3}{1 - 0} = 2 \).
- If we assume more points follow this slope, the rate of change is constant. However, we need to check the fourth table too.
Analyzing the Fourth Table (Bottom - Right):
Points: \((0, 0)\), \((1, 2)\) (only two points shown).
- Slope between \((0, 0)\) and \((1, 2)\): \( \frac{2 - 0}{1 - 0} = 2 \).
- Wait, this also has a slope of \(2\). But the third table (bottom - left) has two points, and the fourth table (bottom - right) also has two points. Wait, maybe the third table is incomplete, but let’s re - check.
Wait, the fourth table (bottom - right) as shown has only two points: \((0, 0)\) and \((1, 2)\). The third table (bottom - left) has \((0, 3)\) and \((1, 5)\) (slope \(2\)). But the problem might have a typo, or we missed points. Wait, no—let’s re - evaluate.
Wait, the bottom - left table (with \(x = 0, y = 3\) and \(x = 1, y = 5\)) has a constant slope of \(2\) for the two points. If we assume it’s a linear function (since only two points are given, and two points define a line), this could be linear. However, the bottom - right table (with \(x = 0, y = 0\) and \(x = 1, y = 2\)) also has a slope of \(2\). But maybe the original problem had more points, but based on the visible data:
Wait, no—let’s re - check the first two tables. The first table has changing slopes, the second too. The third table (bottom - left) with \((0, 3)\) and \((1, 5)\) has a slope of \(2\). The fourth table (bottom - right) with \((0, 0)\) and \((1, 2)\) has a slope of \(2\). But maybe the intended answer is the bottom - left table (or bottom - right, but let’s confirm).
Wait, no—maybe the third table (bottom - left) is the one with a constant slope for the visible points. Wait, no, the bottom - right table: \((0, 0)\) and \((1, 2)\) have a slope of \(2\). But the third table: \((0, 3)\) and \((1, 5)\) also slope \(2\). However, the problem likely expects the table with a constant slope. Let’s re - check the first two tables:
First table: slopes \(1, 3, 5\) (not constant).
Second table: slopes \(-1, -3, -5\) (not constant).
Third table: slope \(2\) (constant for two points).
Fourth table: slope \(2\) (constant for two points).
But maybe the original problem had a different setup. Wait, perhaps the bottom - left table (with \(x = 0, y = 3\) and \(x = 1, y = 5\)) is the answer, or the bottom - right. But let’s assume the bottom - left (or bottom - right) has a constant slope. Wait, no—let’s re - check the problem statement. The question is “Which could…

Snap & solve any problem in the app
Get step-by-step solutions on Sovi AI
Photo-based solutions with guided steps
Explore more problems and detailed explanations
The table with \( x \) and \( y \) values:
| \( x \) | \( y \) |
|---|---|
| \( 1 \) | \( 5 \) |
(or the table with \( x = 0, y = 0 \); \( x = 1, y = 2 \), depending on the full problem, but the bottom - left table is a valid candidate for a linear function’s partial values.)