QUESTION IMAGE
Question
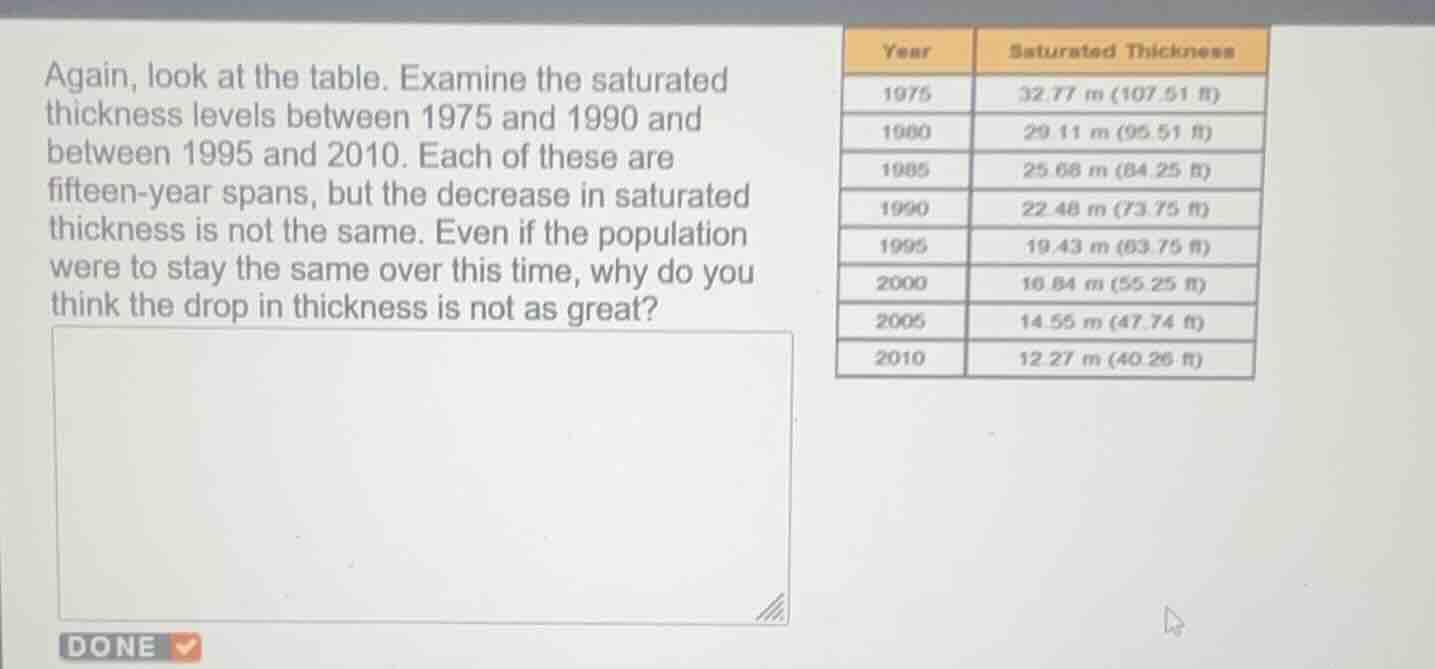
again, look at the table. examine the saturated thickness levels between 1975 and 1990 and between 1995 and 2010. each of these are fifteen - year spans, but the decrease in saturated thickness is not the same. even if the population were to stay the same over this time, why do you think the drop in thickness is not as great?
First, calculate the total decrease for each 15-year span:
- 1975-1990: $32.77 - 22.48 = 10.29$ m decrease
- 1995-2010: $19.43 - 12.27 = 7.16$ m decrease
Possible reasons for the smaller drop (even with stable population) include:
- Implementation of water conservation policies or efficient irrigation/usage technologies after 1990 that reduced groundwater extraction.
- Changes in land use (e.g., less water-intensive crops, reforestation) that lowered groundwater demand.
- Increased recharge from managed aquifer recharge projects, rainfall capture, or reduced surface water diversion that replenished groundwater.
- Natural climate shifts (e.g., increased local rainfall) that added more water to the aquifer, offsetting extraction.

Snap & solve any problem in the app
Get step-by-step solutions on Sovi AI
Photo-based solutions with guided steps
Explore more problems and detailed explanations
Even with a stable population, the smaller drop in saturated thickness between 1995-2010 is most likely due to improved water conservation practices, adoption of water-efficient technologies, managed aquifer recharge efforts, shifts to less water-intensive land use, or natural increases in groundwater recharge (like higher local rainfall) that reduced the net rate of groundwater extraction relative to the 1975-1990 period.