QUESTION IMAGE
Question
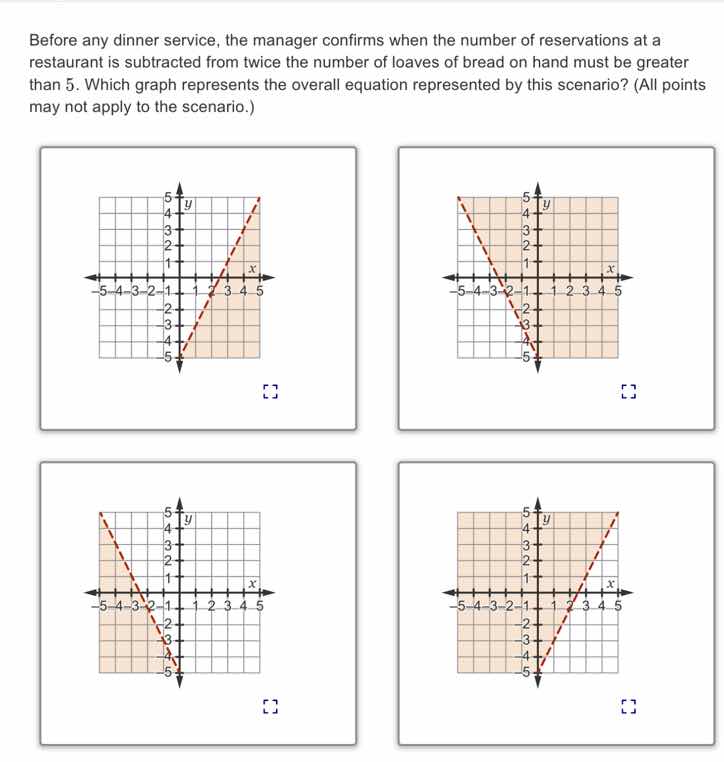
before any dinner service, the manager confirms when the number of reservations at a restaurant is subtracted from twice the number of loaves of bread on hand must be greater than 5. which graph represents the overall equation represented by this scenario? (all points may not apply to the scenario.)
Step1: Define Variables
Let \( x \) be the number of reservations and \( y \) be the number of loaves of bread. The scenario gives the inequality: \( 2y - x > 5 \). Rearrange to slope - intercept form (\( y=mx + b \)):
Add \( x \) to both sides: \( 2y>x + 5 \).
Divide by 2: \( y>\frac{1}{2}x+\frac{5}{2} \) (or \( y > 0.5x+2.5 \)).
Step2: Analyze the Boundary Line
The boundary line is \( y=\frac{1}{2}x + 2.5 \), which has a slope of \( \frac{1}{2} \) (positive) and a y - intercept of \( 2.5 \). Since the inequality is \( y>\frac{1}{2}x + 2.5 \), the line should be dashed (because the inequality is strict, \(>\) not \( \geq \)) and we shade above the line.
Now let's analyze the slope and intercept of the boundary lines in the graphs:
- A line with a positive slope (going up from left to right) and a y - intercept around \( 2.5 \) (or \( \frac{5}{2} \)) is what we need. Let's check the slope of the lines in the graphs. The first graph (top - left) has a line with a positive slope. Let's find two points on the line. If we consider the line \( y=\frac{1}{2}x+\frac{5}{2} \), when \( x = 1 \), \( y=\frac{1 + 5}{2}=3 \); when \( x=3 \), \( y=\frac{3 + 5}{2}=4 \). The line in the top - left graph has a positive slope and the shading is above the dashed line, which matches our inequality \( y>\frac{1}{2}x + 2.5 \).
Wait, let's re - check the inequality derivation. Wait, the original inequality is \( 2y-x>5 \), so \( 2y>x + 5\), \( y>\frac{1}{2}x+\frac{5}{2} \). The slope is \( \frac{1}{2}\) (positive), y - intercept \( \frac{5}{2}=2.5 \).
Now let's check the four graphs:
- Top - left graph: Dashed line, positive slope, shading above the line. Let's find the equation of the line. Let's take two points on the dashed line. If we assume the line passes through (1, 3) and (3, 4), the slope \( m=\frac{4 - 3}{3 - 1}=\frac{1}{2} \), and using point - slope form \( y - 3=\frac{1}{2}(x - 1)\), \( y=\frac{1}{2}x-\frac{1}{2}+3=\frac{1}{2}x+\frac{5}{2} \), which matches our boundary line equation. And the shading is above the line (since for a point like (0,5), plug into \( y>\frac{1}{2}x + 2.5 \), \( 5>0 + 2.5 \), which is true, and (0,5) is in the shaded region of the top - left graph).
- Top - right graph: The line has a negative slope (going down from left to right), so it can't be our line (our slope is positive).
- Bottom - left graph: The line has a negative slope, so it can't be our line.
- Bottom - right graph: The shading is below the line, but our inequality is \( y>\) the line, so we need shading above.

Snap & solve any problem in the app
Get step-by-step solutions on Sovi AI
Photo-based solutions with guided steps
Explore more problems and detailed explanations
The top - left graph (the first graph in the top row) represents the inequality \( 2y - x>5 \) (or \( y>\frac{1}{2}x+\frac{5}{2} \)). If we assume the graphs are labeled as follows (top - left, top - right, bottom - left, bottom - right), the answer is the top - left graph. If we consider the visual elements, the graph with the dashed line with positive slope and shading above the line (the one in the top - left corner of the four - graph set) is the correct one.