QUESTION IMAGE
Question
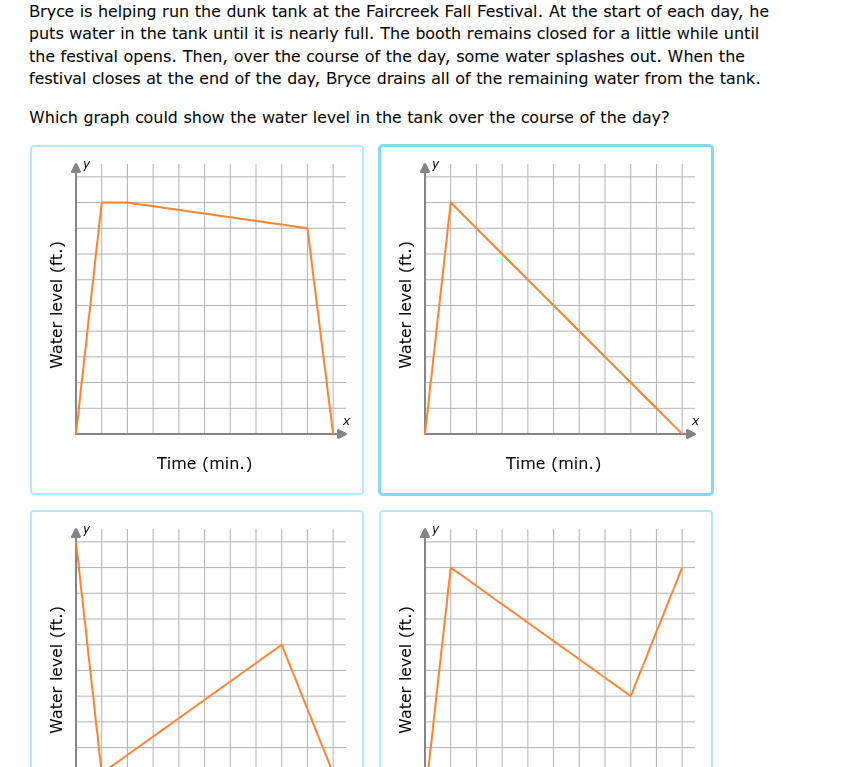
bryce is helping run the dunk tank at the faircreek fall festival. at the start of each day, he puts water in the tank until it is nearly full. the booth remains closed for a little while until the festival opens. then, over the course of the day, some water splashes out. when the festival closes at the end of the day, bryce drains all of the remaining water from the tank. which graph could show the water level in the tank over the course of the day?
Step1: Identify initial phase
Water level rises rapidly to near full: $\text{Water level} \uparrow \text{ sharply to max}$
Step2: Identify closed booth phase
Level stays constant (no splashing): $\text{Water level} = \text{constant}$
Step3: Identify open booth phase
Water splashes out slowly: $\text{Water level} \downarrow \text{ gradually}$
Step4: Identify closing phase
All water drained quickly: $\text{Water level} \downarrow \text{ sharply to } 0$

Snap & solve any problem in the app
Get step-by-step solutions on Sovi AI
Photo-based solutions with guided steps
Explore more problems and detailed explanations
Top-left graph (first graph, with a flat segment, gradual decrease, then sharp drop to 0)