QUESTION IMAGE
Question
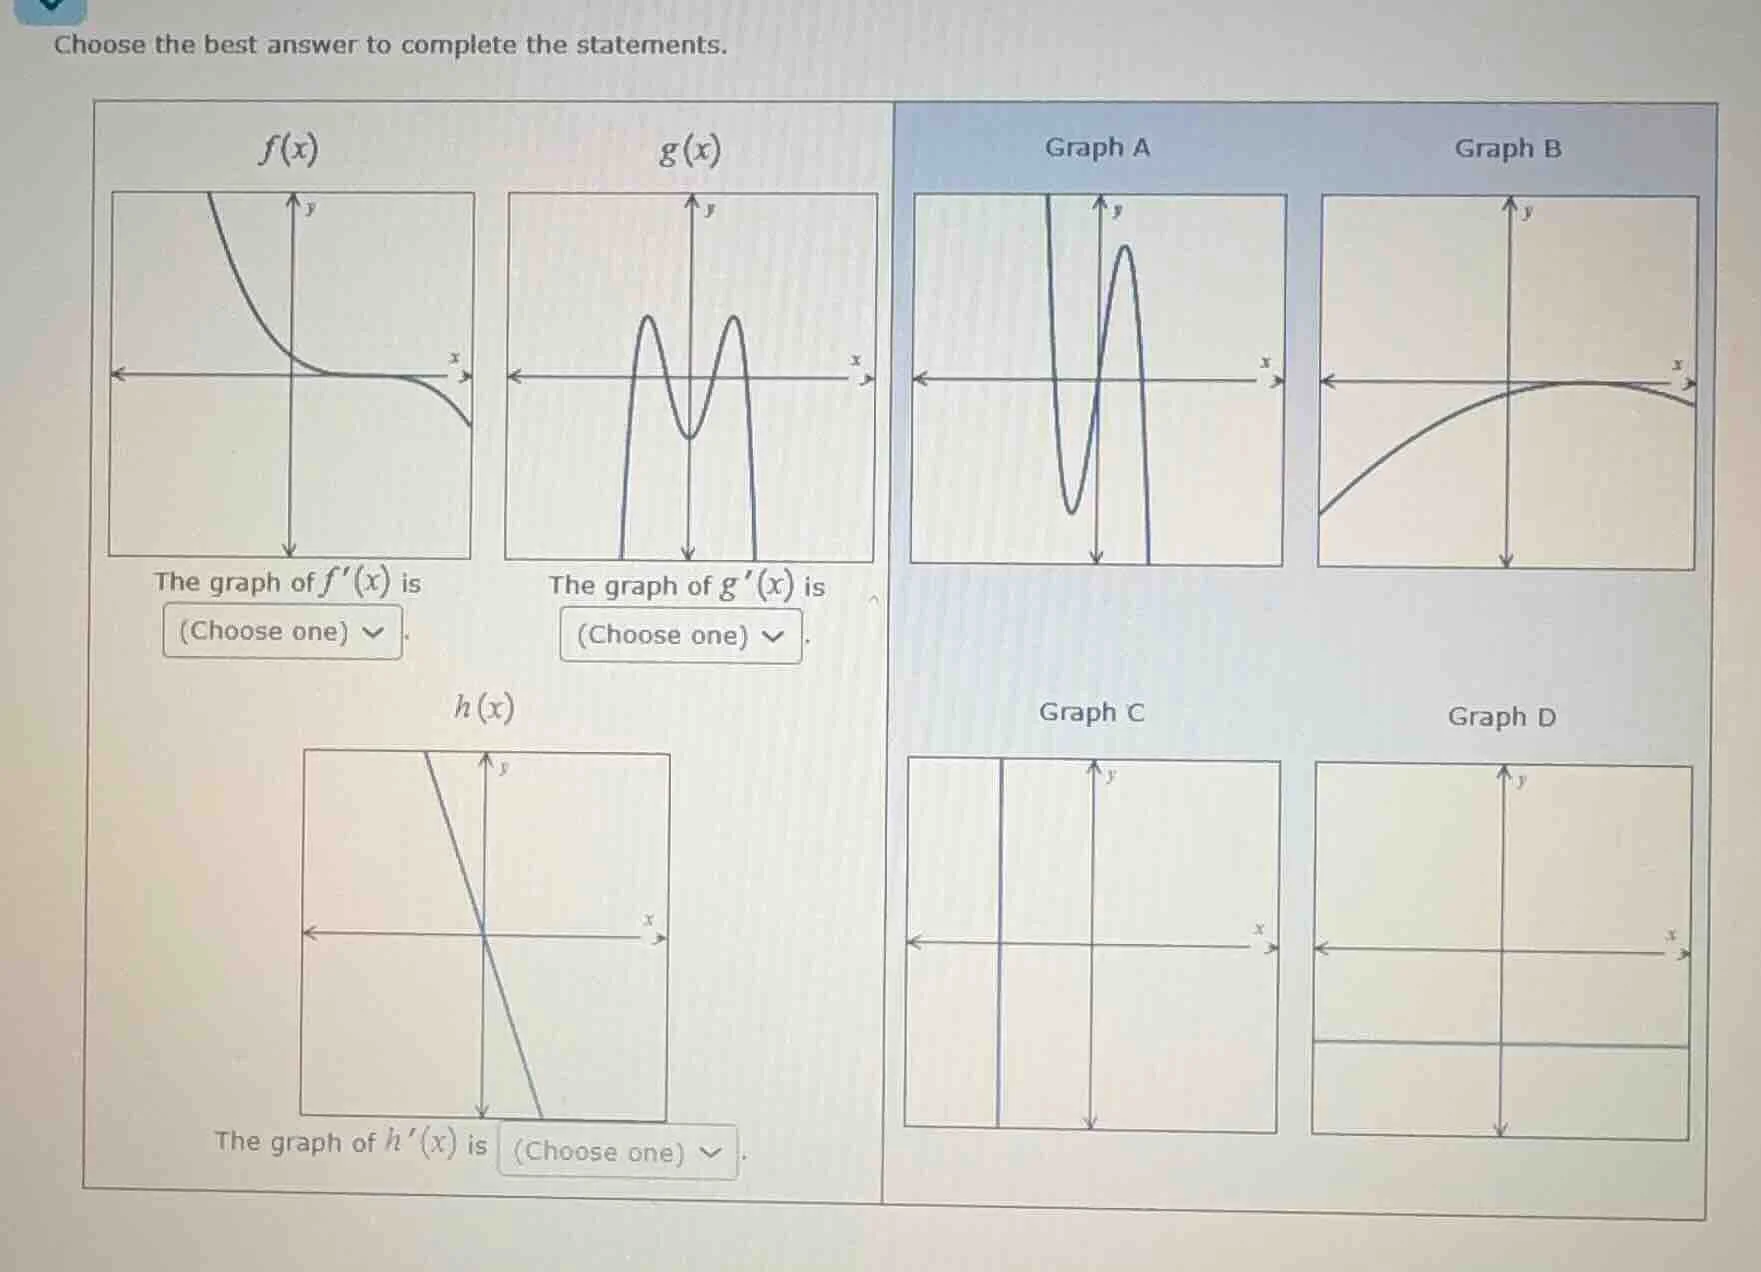
choose the best answer to complete the statements.
the graph of $f(x)$ is (choose one)
the graph of $g(x)$ is (choose one)
the graph of $h(x)$ is (choose one)
(graphs: $f(x)$ curve, $g(x)$ m - shaped, $h(x)$ line; graph a: two vertical asymptotes and a curve, graph b: a curve, graph c: two vertical lines, graph d: horizontal line)
Step1: Analyze $f(x)$ graph
The graph of $f(x)$ is always decreasing, and its slope becomes less steep (approaching 0) as $x$ increases. This means $f'(x)$ is always negative, starts with a large negative value, and approaches 0 from below. This matches Graph B.
Step2: Analyze $g(x)$ graph
The graph of $g(x)$ first increases, then decreases, then increases again. So $g'(x)$ will be positive, then negative, then positive, forming a "valley-peak-valley" shape that matches Graph A.
Step3: Analyze $h(x)$ graph
The graph of $h(x)$ is a straight line with a constant negative slope. This means $h'(x)$ is a constant negative value, which matches Graph D.

Snap & solve any problem in the app
Get step-by-step solutions on Sovi AI
Photo-based solutions with guided steps
Explore more problems and detailed explanations
- The graph of $f'(x)$ is Graph B
- The graph of $g'(x)$ is Graph A
- The graph of $h'(x)$ is Graph D